









A section with key insights from State of Pet Adoption Platform Insights 2026
3. Why are some pets waiting so much longer than others?

The pets who had not been adopted by the time the cohort window closed are not a gap in the data. They are one of the most important findings in this report.
Of the pets listed between July 2025 and March 2026, 5,124 had not been adopted by 30 June 2026, compared with 5,878 the year before. That is about one in ten animals in the cohort.

What last year's report found
The 2025 report noticed something unusual. Adoption rates were falling, but so was the time it took pets to be adopted. That combination suggested that popular pets were still being adopted quickly, while some harder-to-place pets were being removed from listings without being adopted.
Pets still waiting at the end of the year
At 30 June 2026, 4,725 pets that were listed during the reference period were still available for adoption. These are real pets in foster homes, kennels and shelters, still waiting for a home.
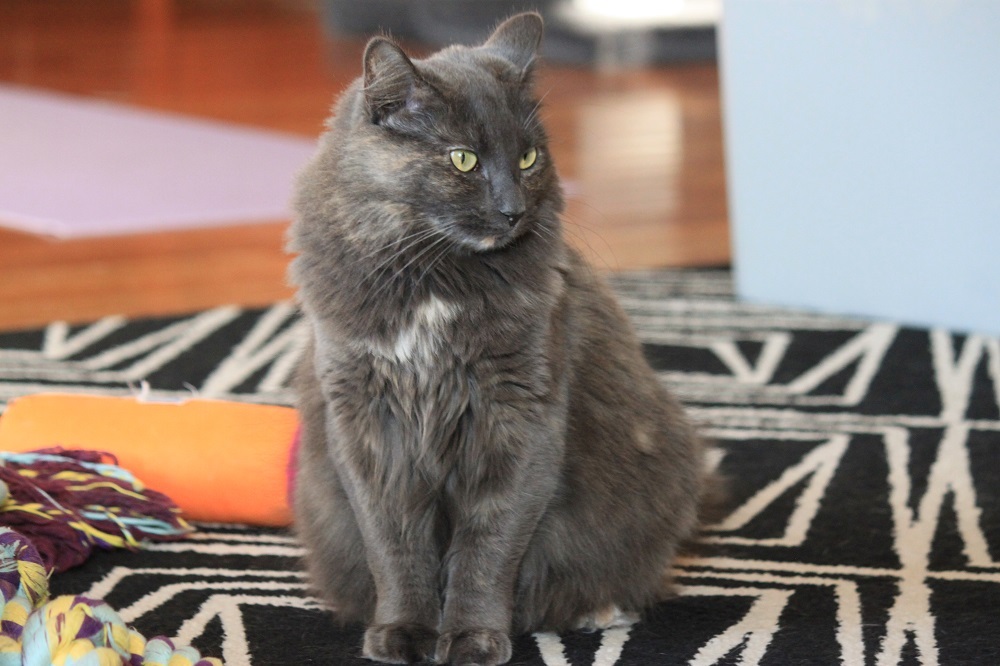
Image: Amelia has been waiting for over 7 years via Forever Friends Animal Rescue
The remaining 399 had their listings removed from the platform without an adoption being recorded. As Section 5 explains, a removal can mean a pet was transferred to another organisation, returned to their guardian, or had another outcome.
Most pets are adopted just as quickly, but a growing group waits much longer
If every pet were simply taking a little longer to find a home, the typical time to adoption would rise across the board. That is not what happened.
Most pets are being adopted just as quickly as before, or faster, while a smaller group is waiting substantially longer, and that group is growing.
The table below shows this using percentiles. Imagine lining up every adopted animal from fastest to slowest. The median (50th percentile) is the animal in the middle: half were adopted faster, half slower. The 90th percentile is the animal nine-tenths of the way along the line: only one in ten waited longer than that.
The median and 75th percentile barely moved (10.7 days to 10.1 days, and 30.8 days both years). But the slowest animals waited much longer: the 95th percentile rose from 98.9 to 111.9 days, and the 99th percentile from 180.7 to 214.5 days.

Fewer pets are being listed, and more of them are waiting longer to be adopted
Grouping adoptions by how long they took shows where the change happened:
⚪ Adoptions completed within 30 days fell by 11.1%.
⚪ Adoptions taking 31 to 90 days fell by 15.9%.
🟠 Adoptions taking 91 to 180 days rose by 4.2%.
🟠 Adoptions taking more than 180 days rose by about 60.3%, from 484 to 776. This was more striking for dogs, where the size of this category rose by 50.6%.
In other words, the fall in adoptions was concentrated among pets who are normally adopted quickly. This fits with what Section 2 showed: fewer animals are reaching the point of being listed, and the falling listings numbers are mostly the 'easy to adopt' pets. Meanwhile, the number of pets who wait more than six months grew sharply.
The sector is not simply slowing down. It is splitting into two groups: pets who find homes quickly, and a growing group who stay in care for much longer.
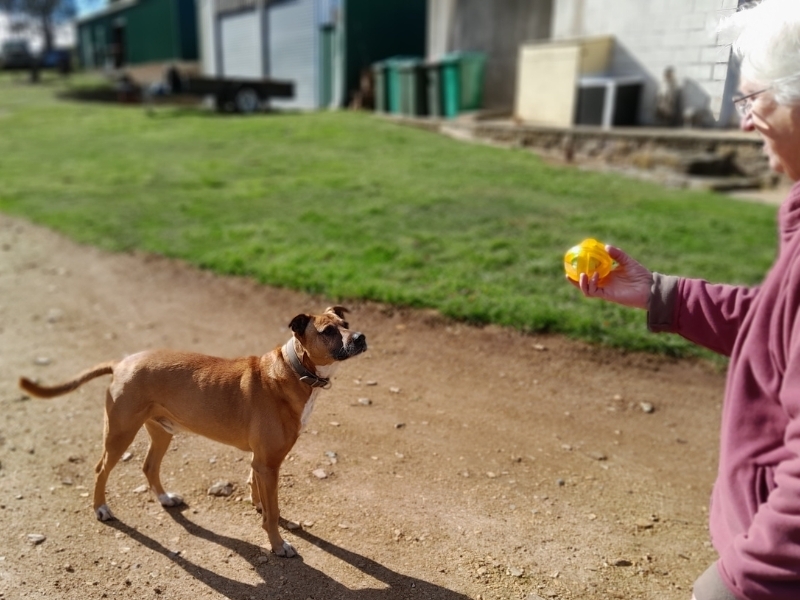
Image: Ninja, adopted after 933 days in care via Oberon Council
The cost of waiting
Another way to see this is to count days of care: the total number of days, added up across every animal, that organisations spent caring for an animal between listing and adoption.
Every one of those days needs space, time, money and people.
Among pets listed between July 2025 and March 2026, adoptions fell by ↓ 8.1% (from 47,867 to 43,974), but days of care fell by only ↓ 2.5%.
For dogs, the two figures moved in opposite directions: ↓ 9.0% fewer dogs were adopted, but ↑ 1.8% more days of care were given to the dogs who were.
Adoption numbers versus care days
|
All pets
Adoptions ↓ 8.1% Care days ↓ 2.5% |
Dogs
Adoptions ↓ 9.0% Care days ↑ 1.8% |
The longest stays take up a much bigger share of care than their numbers suggest:
- Adoptions that took more than 90 days were 7.0% of all adoptions, but used 40.2% of all days of care (up from 33.6% the year before).
- Adoptions that took more than 180 days were just 1.8% (up from 1.0%) of all adoptions, but used 15.5% of all days of care (up from 9.2%).
- Dogs: 9.7% of dog adoptions took more than 90 days.
- Cats: 5.3% of cat adoptions took more than 90 days.
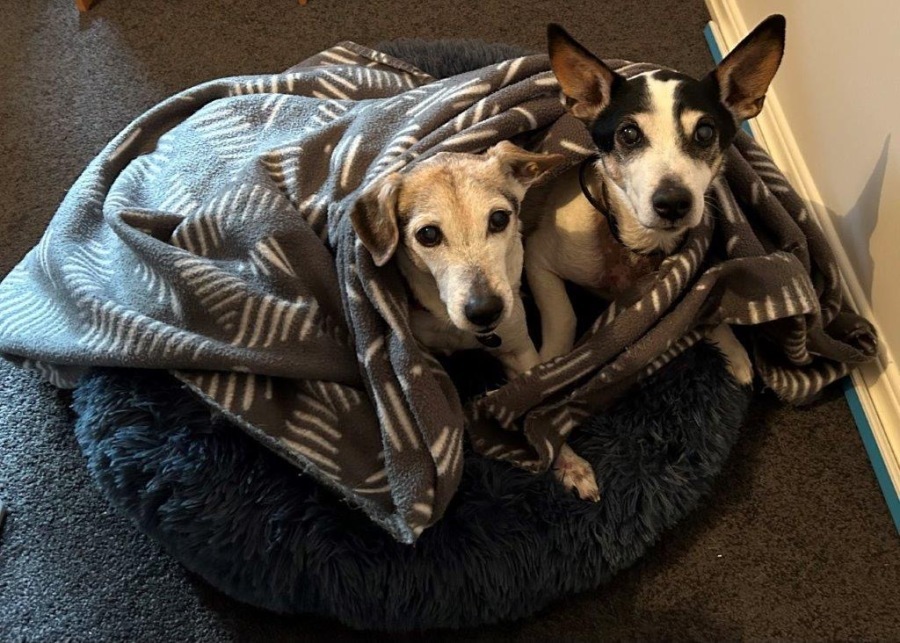
Image: ‘Inseparable seniors’, Ruby and Vincent Silvanus in care with Victorian Dog Rescue
Rescues are carrying most of this weight
Rescues completed 48.0% of all adoptions in 2025–26, but provided 75.6% of all days of care.
Their days of care rose by ↑ 4.8% while their adoptions fell by ↓ 4.1% (from 22,003 to 21,107). Fewer animals moved through Rescues, but each one needed more time and more support.
Fewer pets were moving through rescue organisations, but each one was needing more time and more support.
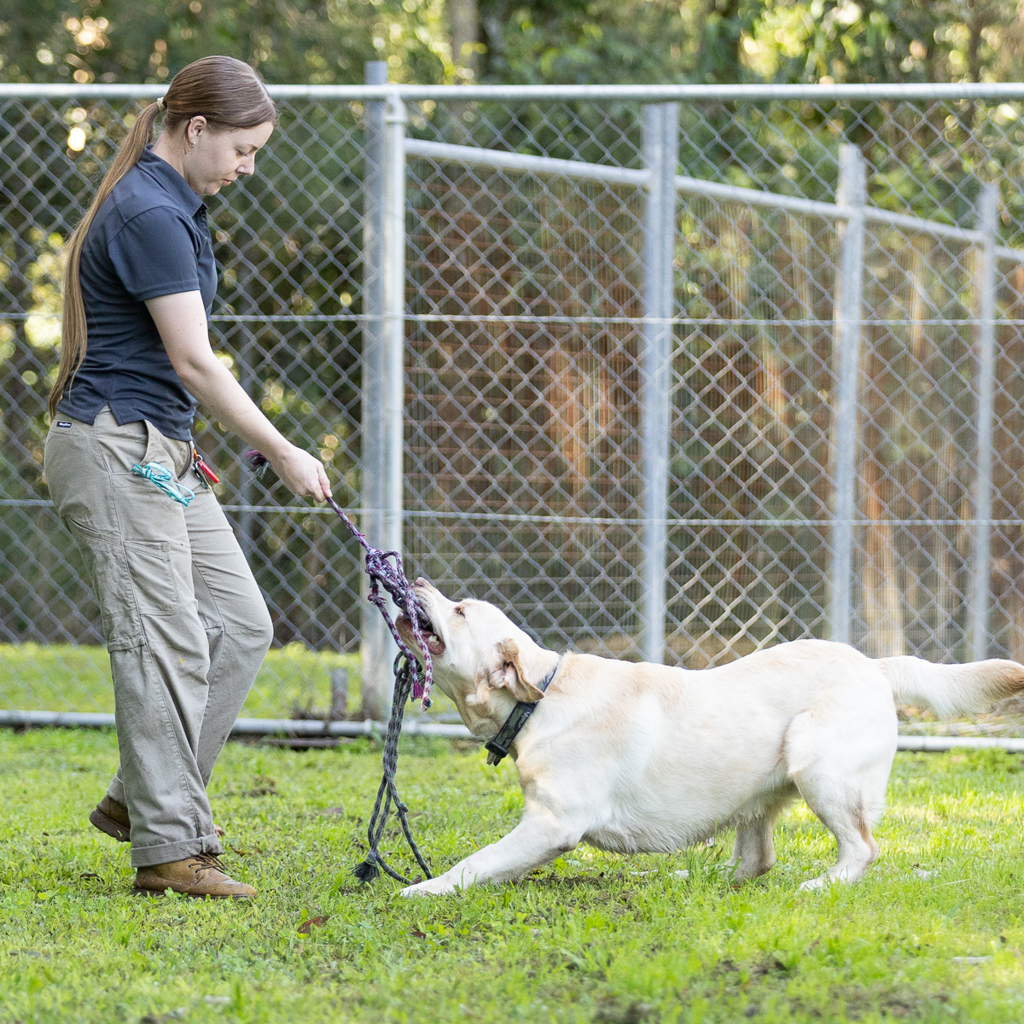
Image: Animal Welfare League Beenleigh, QLD
NFP Shelters, where the median time to adoption is just 3.1 days, show the opposite pattern: their total care days fell by ↓ 19.7%.
The longest waits fall hardest on older pets
Age is another clear dividing line. Adolescents and adults were roughly twice as likely as young juveniles to wait more than 90 days to be adopted, and that gap widened again this year.
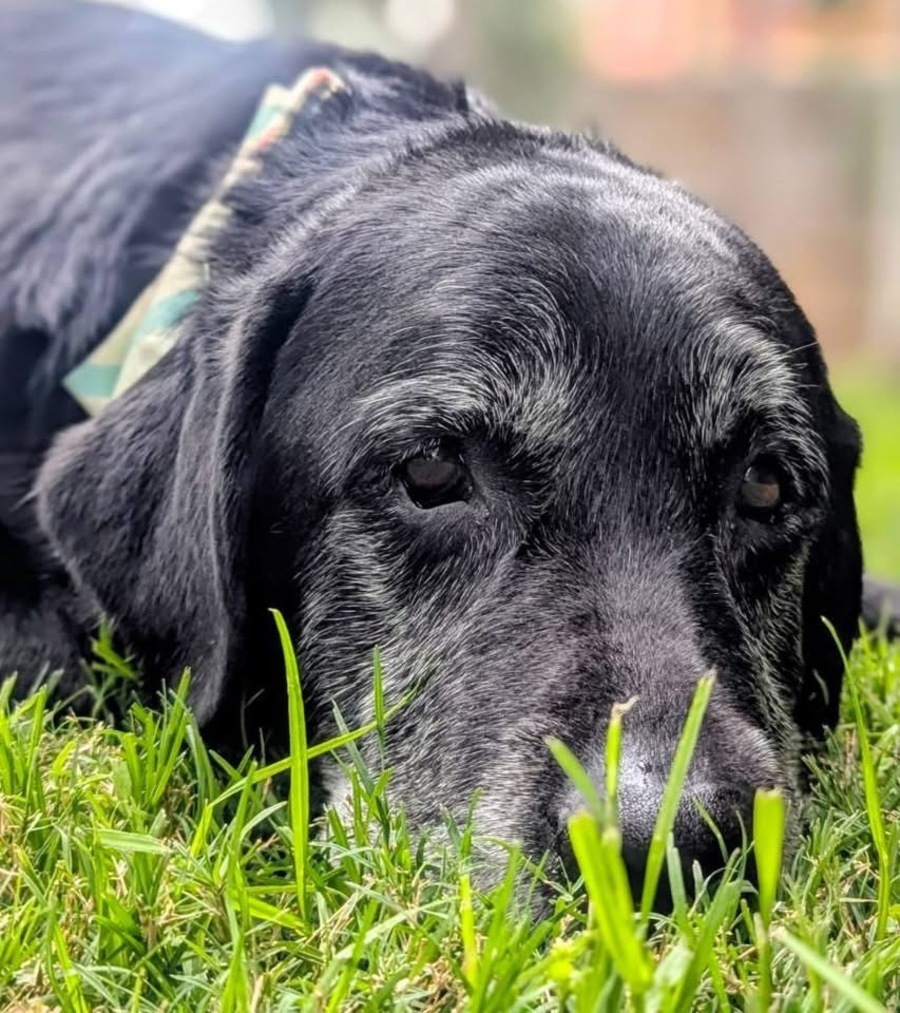
Image: Dapper Gillam profile listing via Starting Over Dog Rescue
Share of adoptions taking more than 90 days, by age:
⚪ Young juveniles: 4.8%
⚪ Adolescents: 9.1%
⚪ Adults: 8.5%
🟠 Waits of more than 180 days rose for every age group, but most sharply for adolescents, doubling from 1.4% to 2.8% of their adoptions.
Dogs feel this more than cats: 9.7% of dog adoptions took more than 90 days, compared with 5.3% of cat adoptions.
When one long wait affects the whole system
What this means in practice is important.
An organisation with a fixed number of foster homes or kennels can only take in a new animal when an existing one leaves. When the hardest-to-place animals stay longer, the whole system's ability to take in new animals shrinks, even though nothing about the organisations themselves has changed.
So a long wait affects more than the animal who is waiting. It also affects the next animal who needs a place to go.
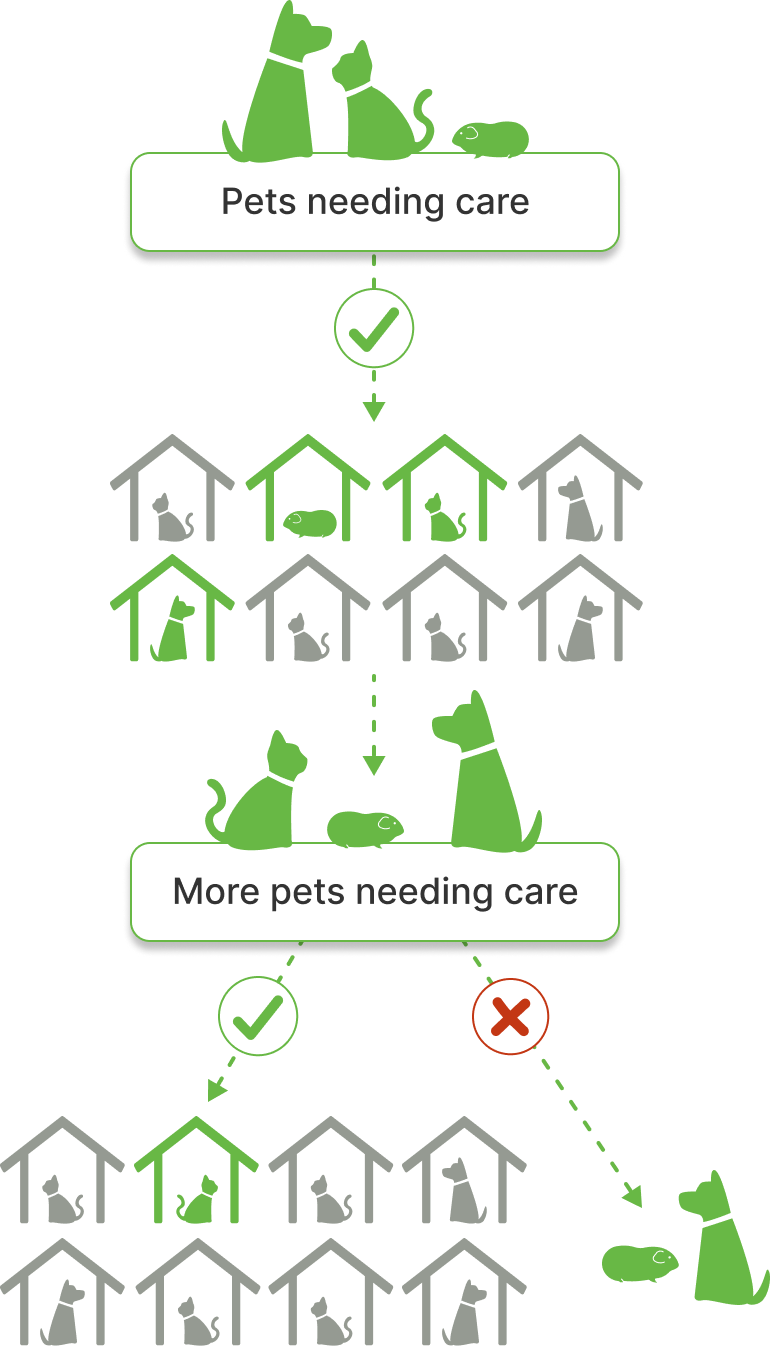
The relationship between increased length of stay and decreased capacity for care underlies nearly every finding in this report.
This link between longer stays and less capacity sits underneath almost every finding in this report. When organisations have to work harder and spend more to achieve the same outcomes for harder-to-place animals, everyone is affected:
🐾 Pets in care, who have fewer resources available to prepare them for life in a new home.
🏠 Pets and guardians seeking help, who find it harder to get help when organisations are full.
💛 The people doing the work, who face more work-related stress, with higher risk of burnout and compassion fatigue.
Jump to specific insights from the report: