


A section with key insights from State of Pet Adoption Platform Insights 2026
1. What is happening nationally?

An adoption rate compares the number of pets adopted with the number listed for adoption. That sounds simple, but the answer depends on which pets you count, and over what period. PetRescue reports use two adoption rates. They answer two different questions, and both appear in this report.
🗓️ Within-period adoption rate: A snapshot of one year
The within-period adoption rate compares the number of pets adopted during the full financial year with the number listed during the full financial year.

For example, if 100 pets were listed during the year and 97 pets were adopted, the within-period adoption rate would be 97%. But those 97 adoptions don't necessarily belong to the 100 pets listed that year. Some pets adopted during the year may have been listed in an earlier year as some pets are listed for over a year.
Because of this, the within-period adoption rate can go above 100%. This is not an error. It means more pets were adopted during the year than were newly listed, because some had been waiting since an earlier year. It happens most often in small groups of pets who take longer to find homes, such as pocket pets.
The within-period adoption rate is best read as a snapshot of how much adoption activity happened during the year, not as a measure of what happened to a particular group of pets.

🔎 Cohort rate: What happened to the pets who were listed during this particular period?
A cohort is a defined group that is followed over time.
The cohort rate takes every pet listed between 1 July 2025 and 31 March 2026, follows them until 30 June 2026, and asks what share of them had been adopted by then.

Stopping new listings on 31 March gives every pet in the group at least three months to find a home before they are counted. The cohort rate cannot go above 100%, because it measures a share of one fixed group.
Why not include April, May and June? A pet listed in late June 2026 would have only a few days to be adopted before the count, while a pet listed in July 2025 would have almost a year. Including the late listings would make the results look worse for reasons that have nothing to do with how pets are actually faring.
For example, a pet listed in March has around three months to be adopted before the results are counted. A pet listed in June would have only a few weeks. Including June listings would therefore give some pets much less time to find a home than others, making the results unfairly difficult to compare.
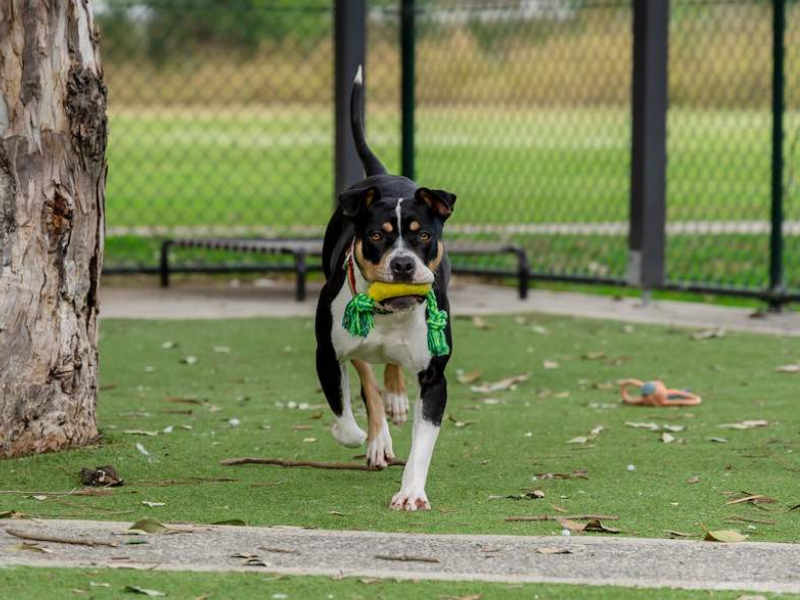
Image: ‘Patches’ adopted via Animal Welfare League NSW - Sydney Shelter (Kemps Creek)
The cohort rate is therefore a better measure of what happened to a defined group of pets, because everyone in the group has had a reasonable and more consistent amount of time to reach an outcome.
Why this report measures speed separately
The 2025 report tracked a monthly adoption rate: the share of pets listed in a month who were also adopted in that same month. That measure combines two things in one number. It tells us both how many pets found homes and how quickly they did. When it falls, we cannot tell whether fewer pets are finding homes, or the same number are finding homes more slowly.
This year, we separated the two. The within-period and cohort rates tell us how many pets found homes. How quickly they found homes is shown separately, using time to adoption (Section 3) and the share of pets adopted within 30 days of listing (Section 2).
What are the changes signalling?
Throughout this report, coloured signals show whether a change is good news, a concern, or neither.
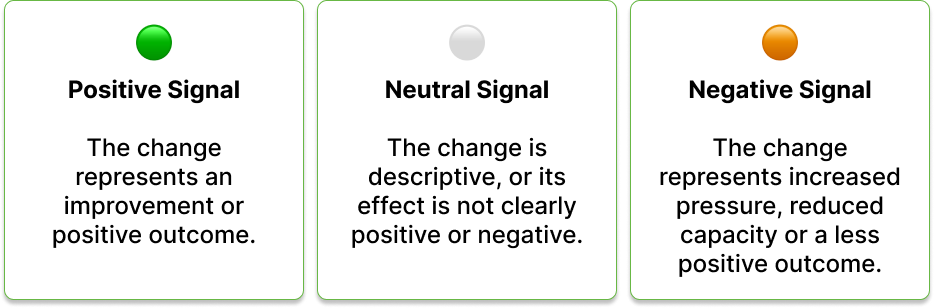
🟢 Positive signal: the change is an improvement for pets, the people caring for them, or both.
⚪ Neutral signal: the change is descriptive, or could be good or bad depending on why it happened.
🟠 Negative signal: the change points to more pressure, less capacity, or a poorer outcome.
The colour does not show whether a number went up or down. For example, a rise in the adoption rate is 🟢, but a rise in the time pets spend in care is 🟠, because it uses up space that the next pet needs.
Understanding percentage changes
- Percent change (%) describes how much a number grew or shrank compared with where it started. If listings fall from 100 to 90, that is a 10% fall.
- Percentage point (pp) describes the difference between two percentages. If an adoption rate rises from 94.0% to 96.8%, it has risen by 2.8 percentage points (pp). It has not risen by 2.8%.
Jump to specific insights from the report: