


The State of Pet Adoption Report - Platform Insights 2026
For more than two decades, PetRescue has worked alongside rescue organisations to help create a future where every pet in Australia is safe, respected, and loved. As the nation's most successful pet adoption platform, PetRescue connects thousands of rescue pets with new families each year by empowering the rescue community with free technology, support, and evidence-based insights that strengthen outcomes for pets and people nationwide.
About PetRescue and the State of Pet Adoption Report series

The State of Pet Adoption Report series brings together national data and real-world insights from rescue groups, shelters, councils, vets. The reports highlight what's happening across the sector, helping PetRescue and its partners understand shifting needs and shape support where it has the greatest impact. By sharing these findings, PetRescue aims to uplift the entire rescue community and celebrate the dedication, resilience, and compassion that define this work.
Read the State of Pet Adoption Reports from previous years:
2020-2021 | 2021-2022 | 2022-2023 | 2023-2024 | Assisted Rehoming insights | 2025
The 2026 Platform Insights report looks at what happened on PetRescue over the 2025–26 financial year (1 July 2025 to 30 June 2026). It covers which pets were listed for adoption, how many found homes, how long that took, and where pressure is building in the system. It draws on listing and adoption records, the accounts and enquiries of people looking to adopt, and PetRescue's guardian support services.
This report follows on from the 2025 State of Pet Adoption: Platform Insights report and the Finding Another Way Home: Five Years of Assisted Rehoming Insights report. Throughout, each section starts with what last year's report found, then looks at what has changed.
About the data in this report
Figures in this report come from PetRescue platform data for the 2025–26 financial year, checked against a snapshot taken on 9 October 2026.
Platform data is live: outcomes are updated after the fact, listings are relisted or deleted, and organisations sometimes change type. This means figures drawn on different days can differ slightly, usually by less than 1%.
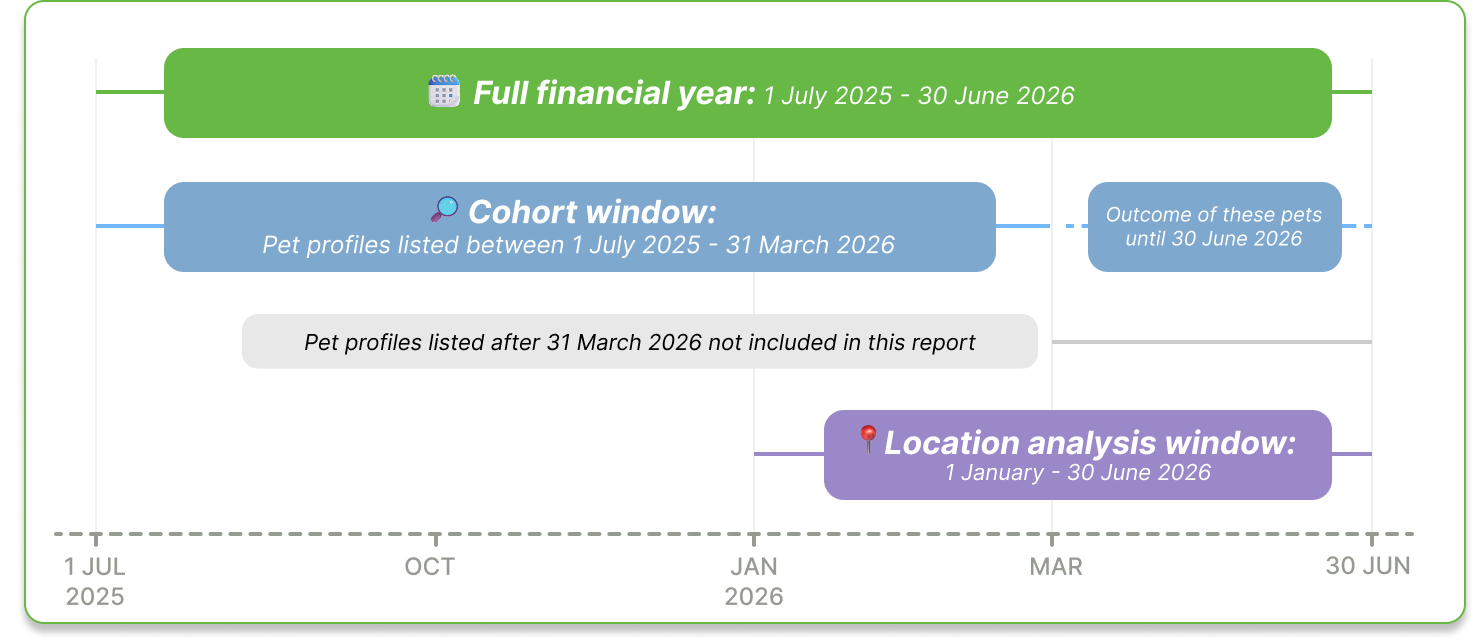
The report uses three time windows, and each section says which one it uses:
🗓️ Full financial year (2025–26): listings activated and adoptions recorded between 1 July 2025 and 30 June 2026. Used for headline listing and adoption numbers and within-period adoption rates.
🔎 Cohort window: pets listed between 1 July 2025 and 31 March 2026, followed until 30 June 2026. Used for cohort adoption rates (see Section 1).
📍 Location analysis window: 1 January to 30 June 2026 is used for location and postcode analysis, because location matching was only available for this period.
Data from one member organisation was removed from this report after a software issue caused a major error in its records during the year.
Note: The 2025 report covered the 2025 calendar year. This report covers the 2025–26 financial year. To make fair comparisons, "last year" in this report means the 2024–25 financial year, recalculated from the same snapshot, unless the text says it is quoting the 2025 report directly.

Key findings
-
Adoption rates held steady, but for a difficult reason. Fewer pets were listed in 2025–26 (66,037, down 7.4%) and fewer were adopted (63,348, down 6.5%). Because listings fell slightly faster than adoptions, the share of listed pets who found homes held steady.
-
Fewer pets found homes quickly. Most pets who were not adopted in their first month did go on to find homes, but only after waiting much longer in care.
-
A small, growing group of pets is waiting much longer. Adoptions that took more than 180 days were just 1.8% (up from 1.0%) of all adoptions, but used 15.5% of all days of care (up from 9.2%).
-
Rescues are carrying most of this load. Among pets listed between July 2025 and March 2026, Rescues completed 48.0% of adoptions but provided 75.6% of all days of care.
-
The number of people looking to adopt held steady. The fall in adoptions came from fewer pets being made available, not from fewer people wanting to adopt.
-
For the first time, we can see where cats come from. Once transfers between organisations are taken into account, urban stray cats likely make up more than half of all cats listed for adoption.
-
Fewer young dogs were removed without being adopted, mostly in Councils. This may partly reflect fewer young dogs being listed by Councils at all.
-
Organisations with a strict adoption policy were the only group whose adoption rate fell, even though their listings barely changed.
-
Pets in NSW remain heavily over-represented among those who are listed again and again without ever being adopted.
Jump to specific insights from the report: