


A section with key insights from State of Pet Adoption Platform Insights 2026
12. Does an organisation’s adoption policy make a difference?
What last year's report found
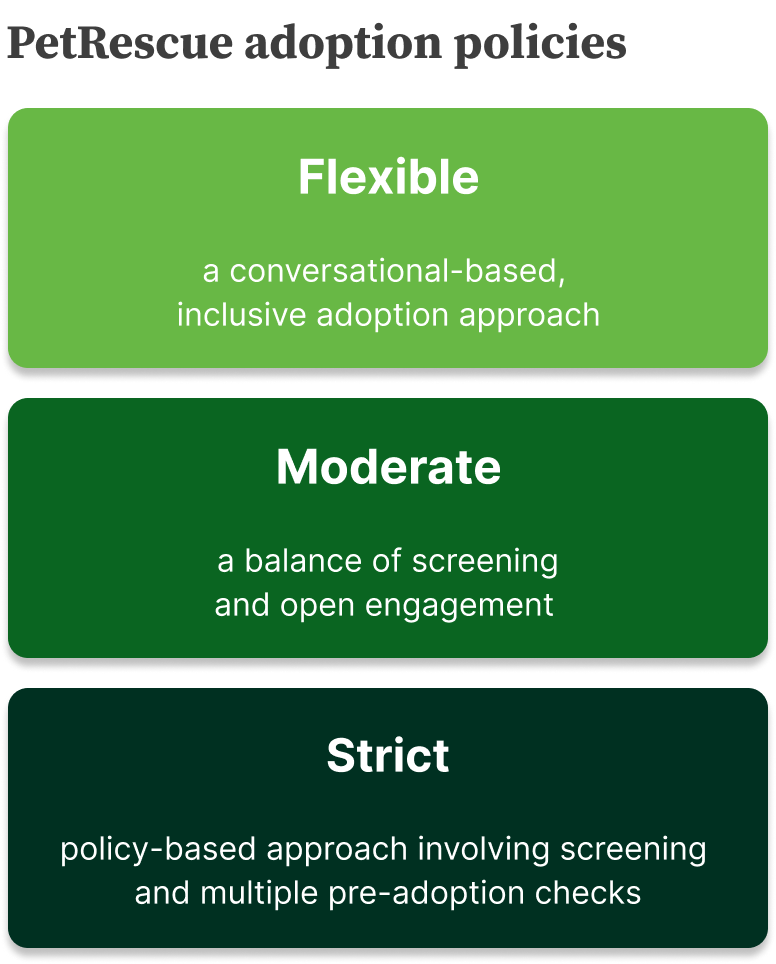
Each organisation on PetRescue chooses an adoption policy label (Flexible, Moderate or Strict) to describe how it matches animals with adopters. The 2025 report found that organisations with Strict policies had the slowest adoptions: the median time to adoption was about three times longer for Strict than for Flexible organisations. For Rescues, Strict-policy cats took 2.8 times as long as Flexible-policy cats to be adopted.

What happened this year
In 2025–26, 76% of active member organisations had chosen a policy label, up from 72% the year before, so the two years can be compared fairly.
One group stands out: organisations with a Strict adoption policy were the only group with a meaningful fall in their adoption rate.
This matters because, across most of this report, adoption rates held steady or rose while listings fell. Strict-policy organisations are the exception. Their listings barely changed (down 0.9%), yet their adoption rate fell by 3.0pp. So their falling rate cannot be explained by fewer animals coming through.
Moderate-policy organisations were the only group whose listings grew (up 2.2%), and their adoption rate rose alongside that growth (up 1.6pp).
The strict-policy effect is concentrated in Rescues
Breaking this down by organisation type shows the fall is concentrated in Rescues. The adoption rate for Strict-policy Rescues fell from 85.1% to 82.0%, while Councils and NFP Shelters with Strict policies both improved slightly.

Time to adoption
Last year's pattern on time to adoption also held.
For Rescue cats, the slowest policy group took 2.6 times as long as the fastest to be adopted (median time to adoption), down slightly from 2.8 times last year. Across all organisations, median time to adoption fell for every policy group (Flexible 7 → 6 days, Moderate 18.7 → 14.4 days, Strict 22 → 18.2 days), but Strict-policy organisations remained the slowest.
Moderate-policy organisations saw more long waits this year: 11.0% of their adoptions took more than 90 days (up from 8.6%), and 3.3% took more than 180 days (up from 1.4%). Flexible-policy organisations held steady, with 3.6% of adoptions taking more than 90 days.
These patterns show policy types and outcomes occurring together. They do not show that a policy itself causes a particular outcome, because organisations with different policies also differ in size, type, location and the animals they care for.
Jump to specific insights from the report: