


A section with key insights from State of Pet Adoption Platform Insights 2025
Understanding the rescue pet adoption landscape
While PetRescue.com.au platform data does not include individual animal intake numbers or locations, we can examine broader trends on the location of member organisations and pet listings to develop a deeper understanding of how at-risk pets interact with the pet adoption sector.
Overall, member location skews towards urban areas with 59% of members located in metropolitan areas. Both rescue and shelter members have the same distribution, however 2 out of 3 council members are located in regional or rural areas.
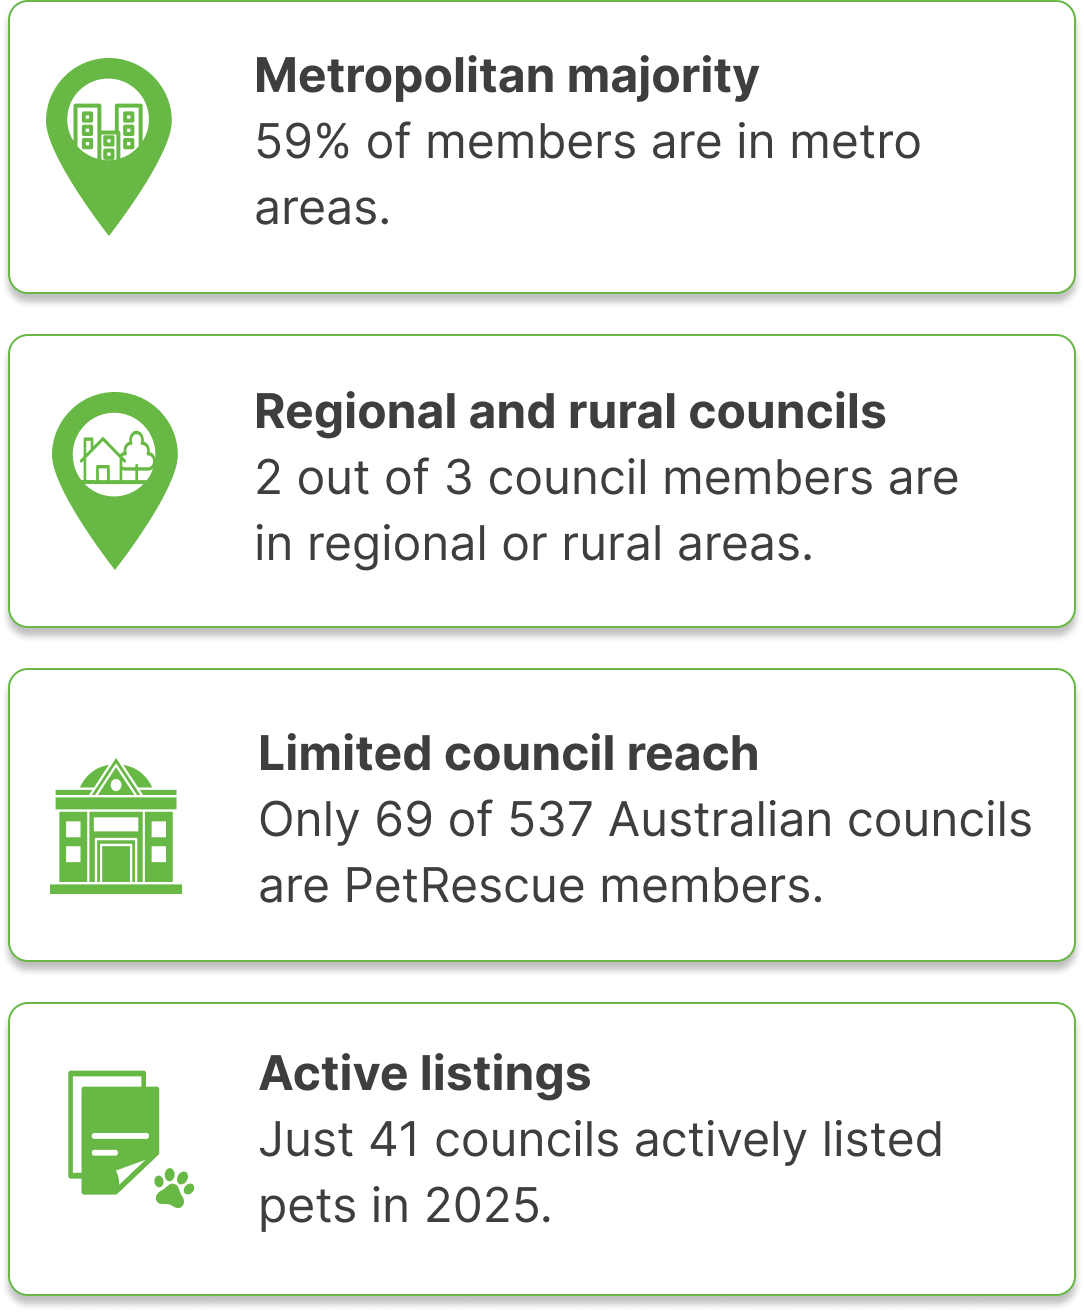
Of the 537 councils in Australia, only 69 are PetRescue members and 41 actively listed pets in 2025.
🏙️ Metropolitan councils typically contract impounding and adoption services to large not-for-profit shelters, or have multiple rescue partnerships with the large number of volunteer rescues concentrated in their local areas.
🌾 The skew towards regional and rural councils being more likely to list pets for direct adoption likely reflects reduced access to contract sheltering and rescue organisation partnerships. Like rural and regional rescues, councils undertaking direct rehoming of pets need to effectively market their pets in a much more challenging environment than their metropolitan counterparts. PetRescue.com.au is the largest and best known pet adoption platform in Australia, meaning it provides vital increased visibility to these pets, increasing the likelihood of them finding a home.
Read about Upper Hunter Shire Council's story, Overcoming barriers to help pets find love.
Member group type, location and species of pet also interact, revealing specific trends:
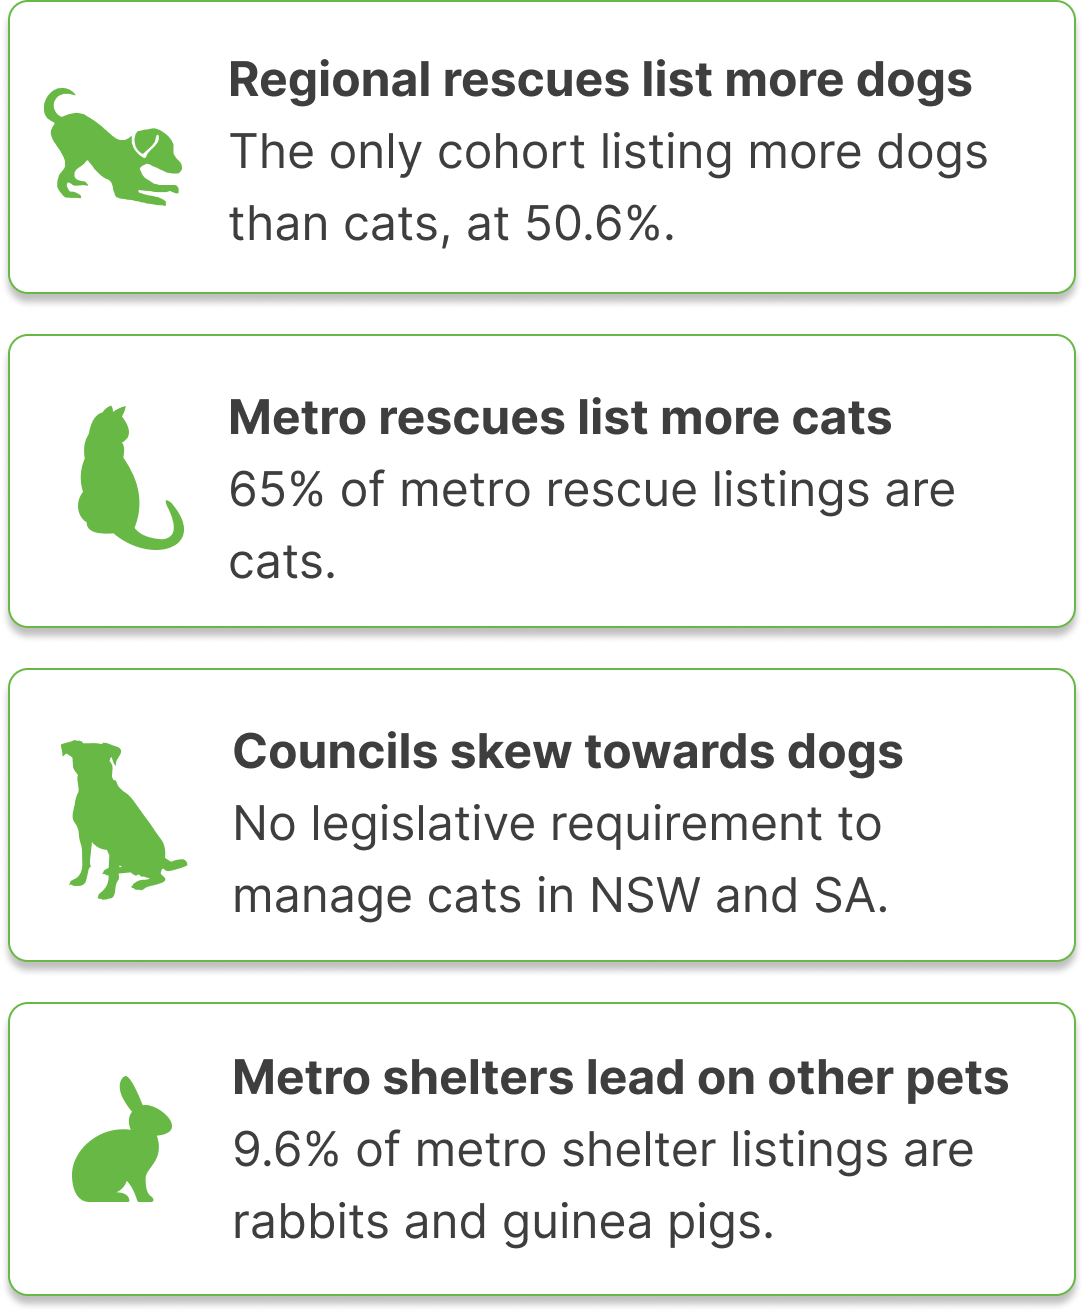
🐕 Regional rescue groups are the only cohort of members that list more dogs than cats (50.6% dogs). In metropolitan areas, rescue group listings are 65% cats.
🏛️ Council listings tend to skew towards dogs. This reflects the majority of council members being located in NSW (56%) or South Australia (6%) where there is no legislative framework requiring local government to manage cats in the community, and the majority of cat adoption is undertaken by shelters and rescues.
🐇 Shelters in metropolitan areas have a notably higher proportion of 'other pets' (9.6%) compared to regional shelters (6.5%) or rescue groups (approximately 2-3%). The majority of these pets are rabbits and guinea pigs, listed by large not-for-profit shelters such as the RSPCA.
To better examine the movement of pets between localities, the location of the listing organisation was compared with the location of the pet listed on their profile. As expected, listing locations were largely proportional to group locations, supporting localised activity of rescue and shelter adoptions.
While a general trend of movement of pets from rural and regional areas to more highly populous areas is expected, the notable exception is member groups located in small towns having a disproportionate number of pet listings in metropolitan areas and regional centres.
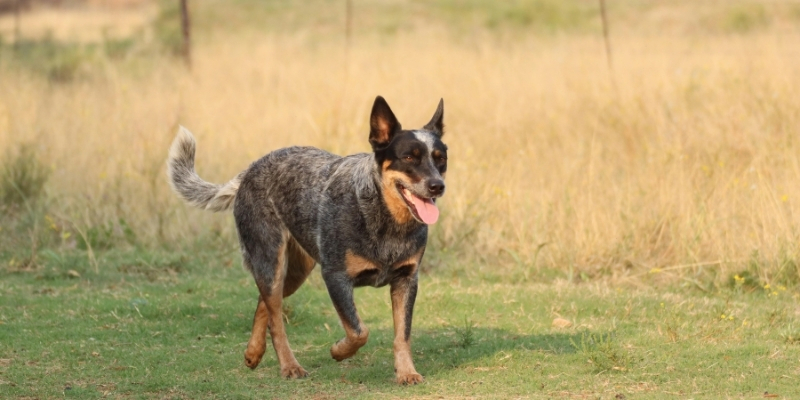
Closer examination showed a number of these organisations have extensive foster care networks spanning state-wide or even interstate, with several also running remote owner-assisted rehoming programs.
These organisations provide a vital live outcome pathway for pets in their surrounding areas, including both direct adoption within their communities and transport to locations with higher adoption interest.
While it is crucial that pets being moved between communities are healthy and able to thrive in the new environment, meaning that animal movement must be undertaken mindfully, these transport pathways have a significant positive impact for pets in need through harnessing support from a widespread community.
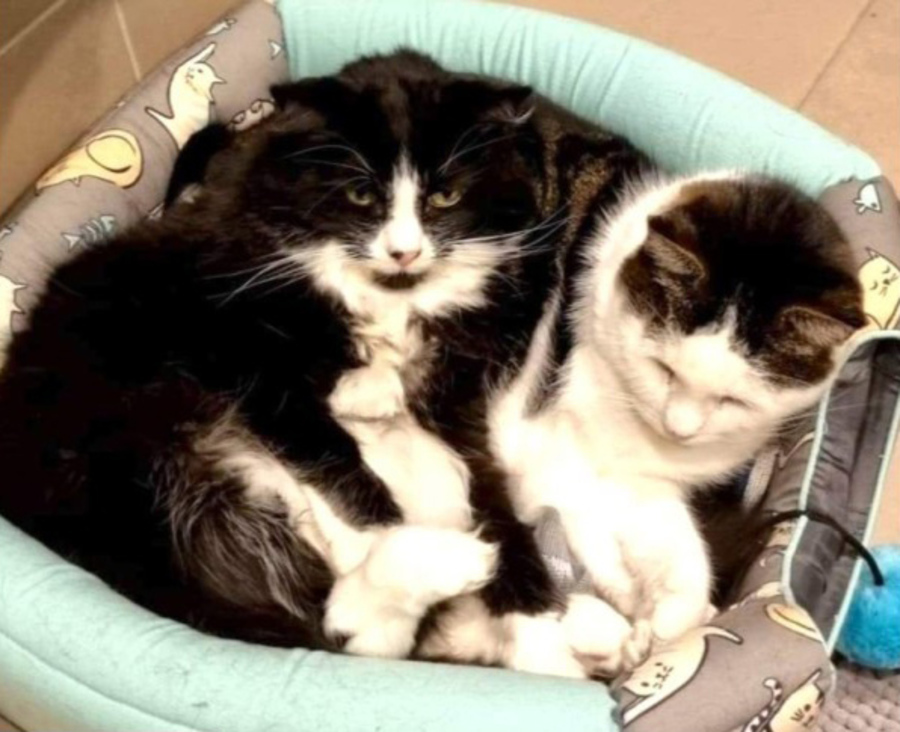
Read about Walter and Jinx's cross country journey
Socioeconomics of pet listings and member organisations
When examining member location by the socioeconomics of their surrounding community, there is a slight but notable skew towards Deciles 1 to 5 (301 members vs 286 in Deciles 6-10). This skew is more notable in council members and, to a lesser extent, not-for-profit shelters, while vet clinic members are over-represented in higher socioeconomic areas and rescue groups are almost equally represented across deciles.
This is consistent with findings from the USA that communities with greater economic stress and lower educational attainment were more likely to have municipal shelters, leading to higher stray intake and animal euthanasia than higher income communities.
When comparing the socioeconomics of listing location (indicative of pet and foster carer location) with that of the member organisations themselves, a clearer pattern of intake and pet care being skewed towards lower income communities emerges. Both total pet listings and the ratio of pets to member organisations are disproportionately represented in SEIFA IRSAD Deciles 2 to 6. This indicates that the majority of pet foster carers, and therefore the majority of work being done by a largely volunteer-run member workforce, is taking place in these communities.
Unlike the drivers of animal flow into the pet sheltering system, systematic drivers of the movement of adopted pets to higher income areas are less clearly articulated in the research literature. It is thought that these drivers include both practical factors, including increased accessibility to pet care services for higher income owners, and cultural factors, such as biases against adopters from minorities and lower income communities.
In the USA specifically, there has been an increasing focus on improving access to shelter services and equity in adoptions, through education and behaviour change initiatives including nation-wide collaborations such as the Maddie's Open Arms Challenge and the Human Animal Support Service Pilot Shelter Program. As a result, across the US animal welfare sector, there is evidence of some progress toward more equitable distribution of pet adoptions, although disparities remain.
Sector data indicate that while pets are still more often adopted into higher-income communities, adoption outcomes are becoming more evenly distributed across socioeconomic groups in some datasets.
Both total pet listings and the ratio of pets to member organisations are disproportionately represented in lower income communities, indicating that the majority of volunteer-run rescue work is taking place in these areas.

Jump to specific insights from the report:
Images: Canva, unless captioned otherwise.