


A section with key insights from State of Pet Adoption Platform Insights 2025
Looking ahead

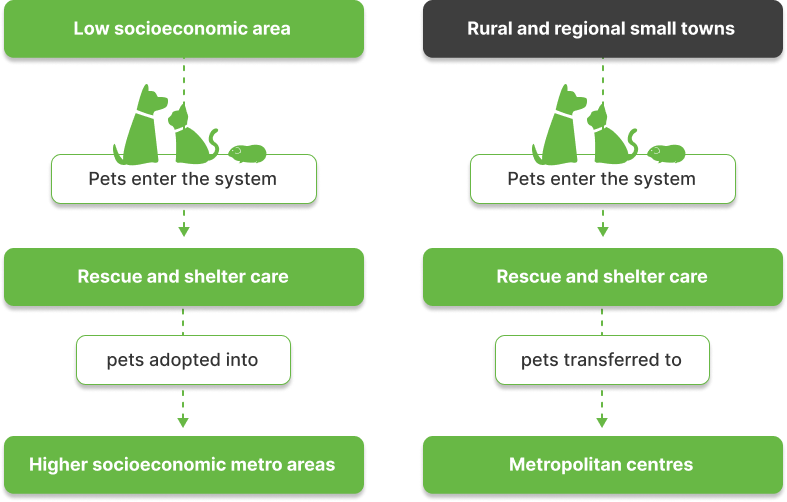
PetRescue platform data supports the finding that, like the USA, at-risk pets in Australia move systematically from lower socioeconomic areas to those with more advantage, highlighting deep structural inequities in the sector. Additionally, there appears to be a flow of pets from rural and regional areas, specifically small towns, to metropolitan centres.
While on surface value, the centering of pet adoption services in areas of high human population makes sense, there is currently a significant mismatch between where pets, specifically dogs, are available for adoption and where dog owners live.
Similarly, at surface value, restrictions on the placement of adopted pets into homes with families experiencing higher levels of disadvantage feels like the right path for those wanting to protect pets from harm. However, research shows that pet ownership rates are highly comparable between those experiencing financial difficulty and those who are more affluent, and that lower-income guardians often prioritise their pet's needs even at personal sacrifice, demonstrating that financial status does not dictate the level of love or commitment a home can offer.
Given the positive impact that pets have on wellbeing, it may well be the case that those experiencing greater hardship benefit more fully from pet ownership than pet guardians with more substantial human support networks.
Research shows that lower-income guardians often prioritise their pet's needs even at personal sacrifice, demonstrating that financial status does not dictate the level of love or commitment a home can offer.
Ensuring that pet owners and adopters from less privileged areas are supported to have pets in their lives is vital because the human-animal bond provides significant mental, physical, and emotional health benefits that should be accessible to all, rather than a privilege reserved for high-income earners.
- Mental health: Companionship and routine from pet guardianship can ease stress, anxiety and loneliness.
- Physical health: Caring for a pet encourages activity and exercise, benefiting guardians of all ages.
- Emotional wellbeing: The human-animal bond offers comfort, connection and a sense of purpose.
Read more about the impact of rescue work on mental and physical health.

Ensuring their pets are fully vet-worked and as physically and behaviourally healthy as they can be benefits not only individual pets and owners, but society as a whole, through reducing intake into the pet welfare system from uncontrolled breeding of sexually entire pets and all the associated negative costs and consequences of high intake.
Operationally, this requires a multi-pronged approach from the Australian animal management, sheltering and rescue sector:
🤝 Increasing owner support and surrender prevention services for existing pet owners to reduce relinquishment
🌏 Broadening the adopter pool to include underserved communities
Transitioning to conversational matching models, as championed by major organisations like Human Animal Support Services (HASS) and the Humane World For Animals (previously HSUS), removes arbitrary barriers that have little or weak evidence to justify their use in pre-adoption screening. This inclusive approach not only increases rehoming speed and efficiency but also builds community-wide trust and engagement, transforming local residents into active partners in an organisation's mission.
High-level species comparisons
In 2025, dogs received their first enquiry much faster than cats:
🐕 Dogs: median 0.8 days to first enquiry
🐈 Cats: median 2.2 days to first enquiry
🐇 Other pets: median 7.1 days to first enquiry

Overall, cats are much less likely than dogs to receive more than 3 enquiries (only 4.8% vs 19.0% for dogs).
However, high-enquiry pets of all species (those with more than 3 enquiries) generate interest from the moment they go live, with the first enquiry arriving almost immediately. Dogs had the highest enquiry rate among the major species at 55.2% of listings receiving at least one enquiry.
Species trends in pet age at listing over time
In 2025, the median age at listing for dogs stabilised following several years of consistent decline following COVID. From 2020 to 2022, the difference between the median and average age for dogs at listing was notably greater than from 2023 onwards, indicating a tightening of age range around 1 year of age in later years with fewer older dogs being listed on the platform.
While the overall number of puppies and adolescent dogs being listed is still of concern as this is an indicator of uncontrolled breeding, the stabilisation in median and average age at listing is a positive sign that perhaps fewer very young puppies will be listed throughout 2026.

The age at listing for cats has been stable at approximately 5 months for at least 6 years, confirming the kitten-dominated pipeline hasn't meaningfully changed since 2020.
Jump to 2025 adoption insights for cat | dog | other species of pet

Cats

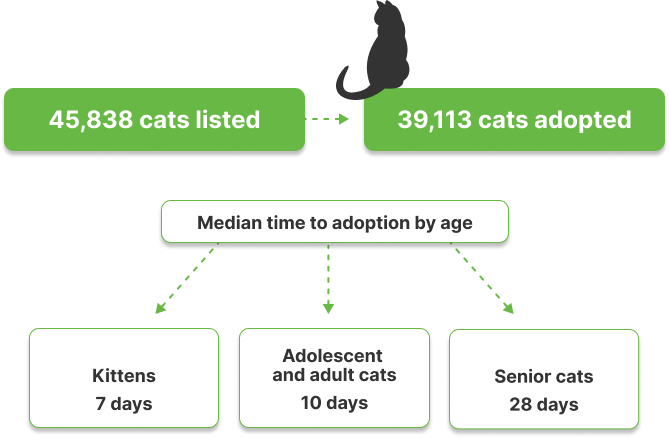
- 45,838 cats were listed in 2025, with 39,113 adopted
- 63% of cat listings in 2025 were for kittens under 6 months of age, with an adoption rate of 93%
- 659 individual cats were listed as seniors, with an adoption rate of 77%
- Median time to adoption by age:
- Kittens: 7 days
- Adolescent and adult cats: 10 days
- Seniors: 28 days
Do cats fare better in different types of adoption organisations?
Shelters and rescue groups each account for roughly half of cat listings (approximately 20,000 each), but with very different outcomes. Shelters listed proportionally fewer kittens, but converted 92.3% of listings to adoptions at a median of just 3.0 days. In comparison, rescue groups converted 77.4% at a median of 19.9 days despite listing a significantly higher proportion of kittens. Rescue groups account for 80% of all cat enquiries (25,056) despite listing only 44% of cats, whereas shelters move cats so fast they rarely accumulate multiple enquiries.
Councils list the lowest proportion of kittens yet achieve the second best adoption outcomes of all member types, with an adoption rate of 90% and a median time to adoption of 8.9 days.
Shelters converted 92.3% of cat listings to adoptions at a median of just 3 days, while rescue groups converted 77.4% at a median of 19.9 days despite listing a higher proportion of kittens.
What makes cats popular with adopters?
The fastest quartile of cats to be adopted were placed within 2.8 days of listing on PetRescue. Traits most common to these cats, and therefore predictive of a faster time to adoption, include:
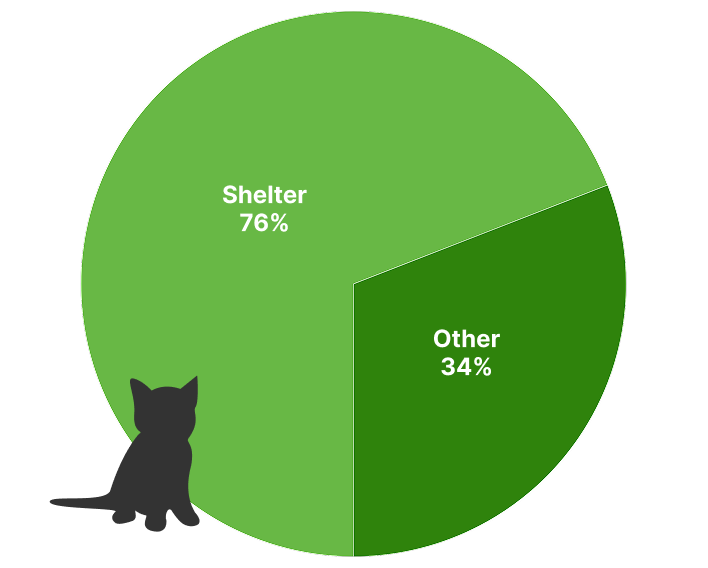
- Being a kitten listed by a shelter. 76% of fast-adopted cats are from shelters vs 34.0% of the rest. Cats from shelters also have the highest adoption conversion with 18,474 adoptions from 20,022 listings (92.3%).
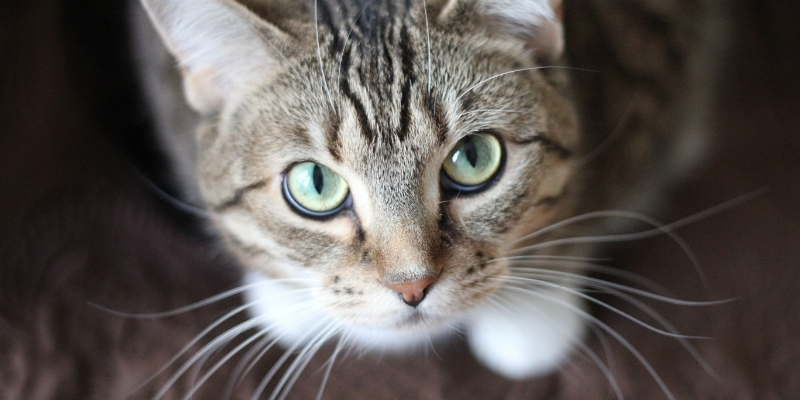
- A cat's coat length had a notable impact on both adoption rate and time to adoption:
- Short coat cats have an adoption rate of 87.1% and a median time to adoption of 7.8 days
- Medium coat cats have an adoption rate of 77.5% and a median time to adoption of 8.8 days
- Long coat cats have an adoption rate of 81.8% and a median time to adoption of 12.2 days

- Being located in Victoria or Queensland, with both states being over-represented by 5-7%, and being cared for by an adoption organisation with a flexible adoption policy (over-represented by 6.5%). Cats in Victoria also have a high rate of high-enquiry listings despite a comparatively short time to adoption, indicating that adoption demand for cats in Victoria was strong in 2025.
Characteristics of higher-risk cat cohorts
Interestingly, fast time to first enquiry and high overall enquiries were poor predictors of fast time to adoption. This is likely due to the disproportionate representation of high-risk cohort cats in rescue groups, who are less likely to have flexible approaches to adoption and rarely have in-person or walk-in adoption processes.
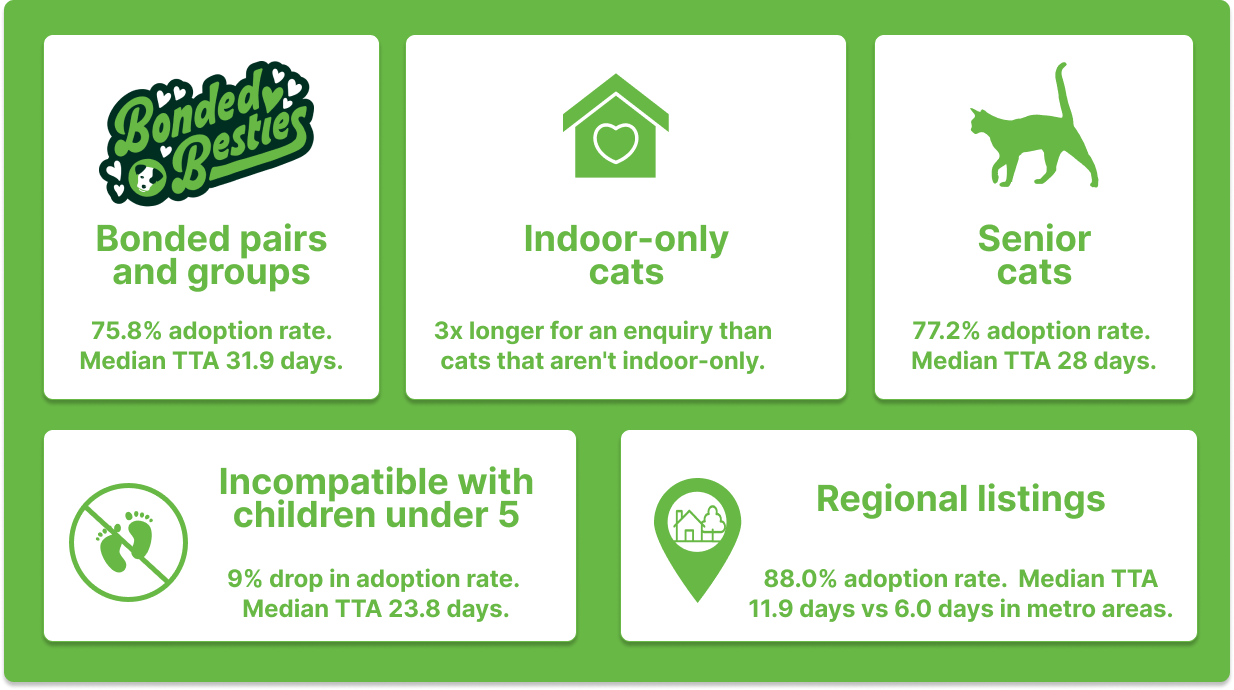
Characteristics of cats that were slowest to be adopted include:
👫 Multiple animals listed together: 75.8% adoption rate, 55.6 day mean TTA, 31.9 day median. Bonded pairs and groups are the single hardest category to place.
🏠 Indoor-only listing: 10.2% of indoor-only cats, the majority listed by rescues, receive more than 3 enquiries vs 6.7% for non-indoor-only and just 1.1% for cats with no indoor flag. However, cats without indoor-only flags receive their first enquiry in a median of 0.9 days, while indoor-only cats take 3.1 days.
🐈⬛ Senior cats: 77.2% adoption rate, 50.1 day mean TTA, 28.0 day median. Older cats face substantially worse outcomes than non-senior adults (87.2%) and have a higher rate (9.6%) of more than 3 enquiry listings than non-seniors (5.2%), consistent with their 3x longer time to adoption.
👶 Being flagged as incompatible with children under 5 years of age, which resulted in a 9% drop in adoption rate and an additional 6 days median TTA (77.6% adoption rate, 46.0 day mean TTA, 23.8 day median). Note: this impact has shifted, as previous State of Pet Adoption Reports noted that restrictions around placement with young children was less impactful for cats than dogs, and had only a negligible effect overall.
📍 Being listed regionally (88.0% adoption rate, 11.9 day median TTA vs 6.0 in metro areas), or with a group with a moderate adoption policy.

The common thread across the worst-performing cohorts is the combination of indoor-only requirement with either NSW or WA location, adult age, or multiple-animal listing. When these factors stack together, adoption rates can drop below 60%.
Adoption restrictions related to living with dogs or other cats had little impact on adoption metrics.
Trends in cat listings over time
Cat listing characteristics were largely stable from 2020 to 2025, with no distinct trends in any feature other than coat length. In 2025, almost 30% more cats, primarily kittens, were labelled as medium-coated with a corresponding drop in short-coated kitten listings.
This trend appears to follow the decreasing enquiry rate and points to groups recategorising kittens previously labelled as short-coated as medium-coated, possibly to increase adoption interest. It may be that there is a perception in the sector that medium coat length in kittens attracts more adoption interest, however platform-level data indicates that short and medium coat cats and kittens have comparable time to adoption, and medium-coated cats have a poorer adoption rate.
Platform data indicates that short and medium coat cats have comparable time to adoption, yet medium-coated cats have a poorer adoption rate, suggesting that recategorising short-coat kittens as medium-coat may not have the intended effect.
Dogs

26,155 dogs were listed in 2025, with 21,079 adoptions and 58,725 enquiries.
Dogs generate nearly twice the enquiries of cats, despite having 43% fewer listings.

Do dogs fare better in different types of adoption organisations?
Rescue groups
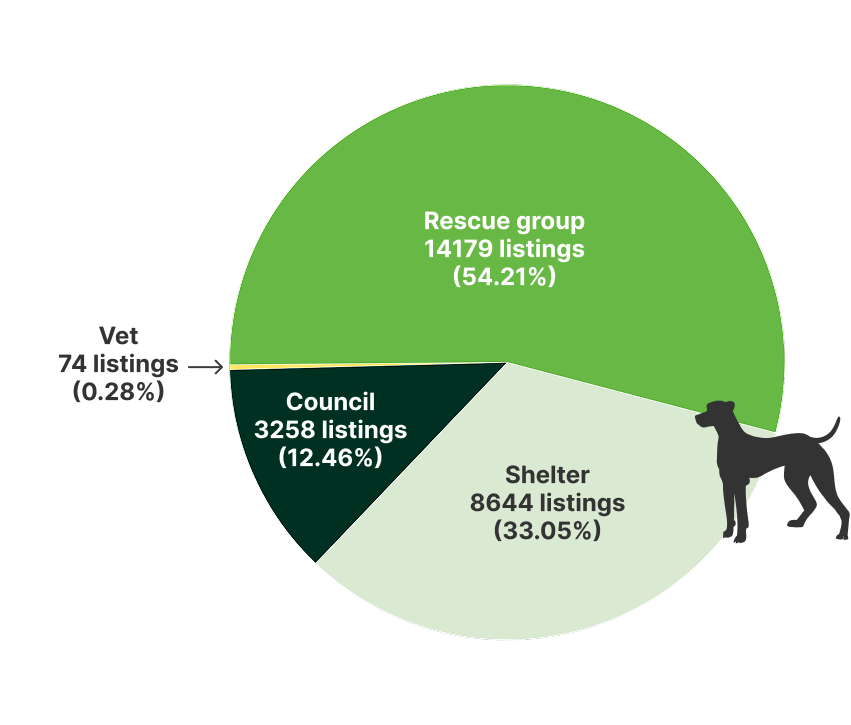
Dominate dog listings with 14,179 (54%) and generate 74% of all dog enquiries (43,777). Despite having the second highest proportion of puppies (60%), rescue group dogs have the poorest adoption metrics of any member type, with a 76.1% adoption rate and median TTA of 22.8 days.

Shelters
List fewer dogs (8,644, 33%) but significantly outperform on outcomes, converting 86.5% of listings to adoption with a median TTA of just 4 days. 66% of the fastest quartile of dog adoptions were listed by shelters.
Councils
List a minority of dogs (12.5%) but have seen listings and adoptions increase on the previous year, with an 84.4% adoption rate and median TTA of 9.8 days, sitting between shelters and rescues.
Vet clinics
Listed very few dogs but had the highest proportion of puppies (66%), which is surprising given their comparatively slow time to adoption. This likely indicates restrictive adoption practices are in place despite high puppy demand.
Of note, in the last 18-24 months, shelters have overtaken councils as the member cohort with the fastest time to adoption for both dogs and cats.
What makes dogs popular with adopters?
As noted in previous State of Pet Adoption reports, small puppies have the fastest adoptions and highest adoption rate and this trend is consistent across states and over time. The fastest quartile of dog adoptions occurred within 5 days and were characterised by the following features:
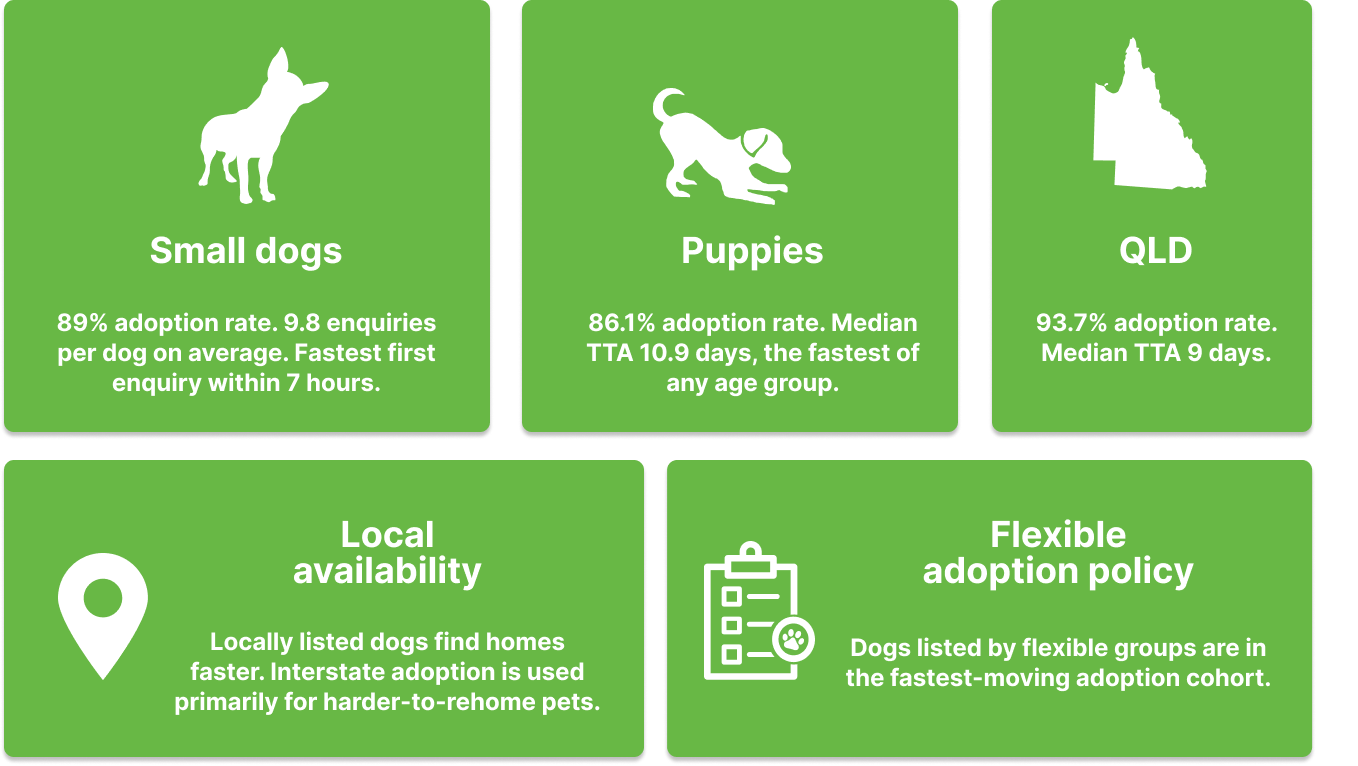
- Size: Small dogs were over-represented in fast adoptions by 8%, with an 89% adoption rate and the fastest first enquiry (median 0.3 days, or roughly 7 hours)
- Despite their shorter time to adoption, small dogs also attract the highest number of enquiries with 9.8 enquiries per dog on average, highlighting the incredibly high demand for small dogs on PetRescue
- Age: Puppies have the highest adoption rate (86.1%) and fastest TTA (median 10.9 days)
- Location: Queensland dogs are over-represented in fast adoptions by 14%, having a 93.7% adoption rate and 9-day median TTA in 2025. Local availability was correlated with fast-moving dogs being over-represented by 18%, confirming that interstate adoption is used primarily to increase the adopter pool for harder-to-rehome dogs
- Adoption policy: Dogs listed by groups with flexible adoption policies were over-represented by 8% in the fastest-moving cohort of dog adoptions
Characteristics of higher-risk dog cohorts
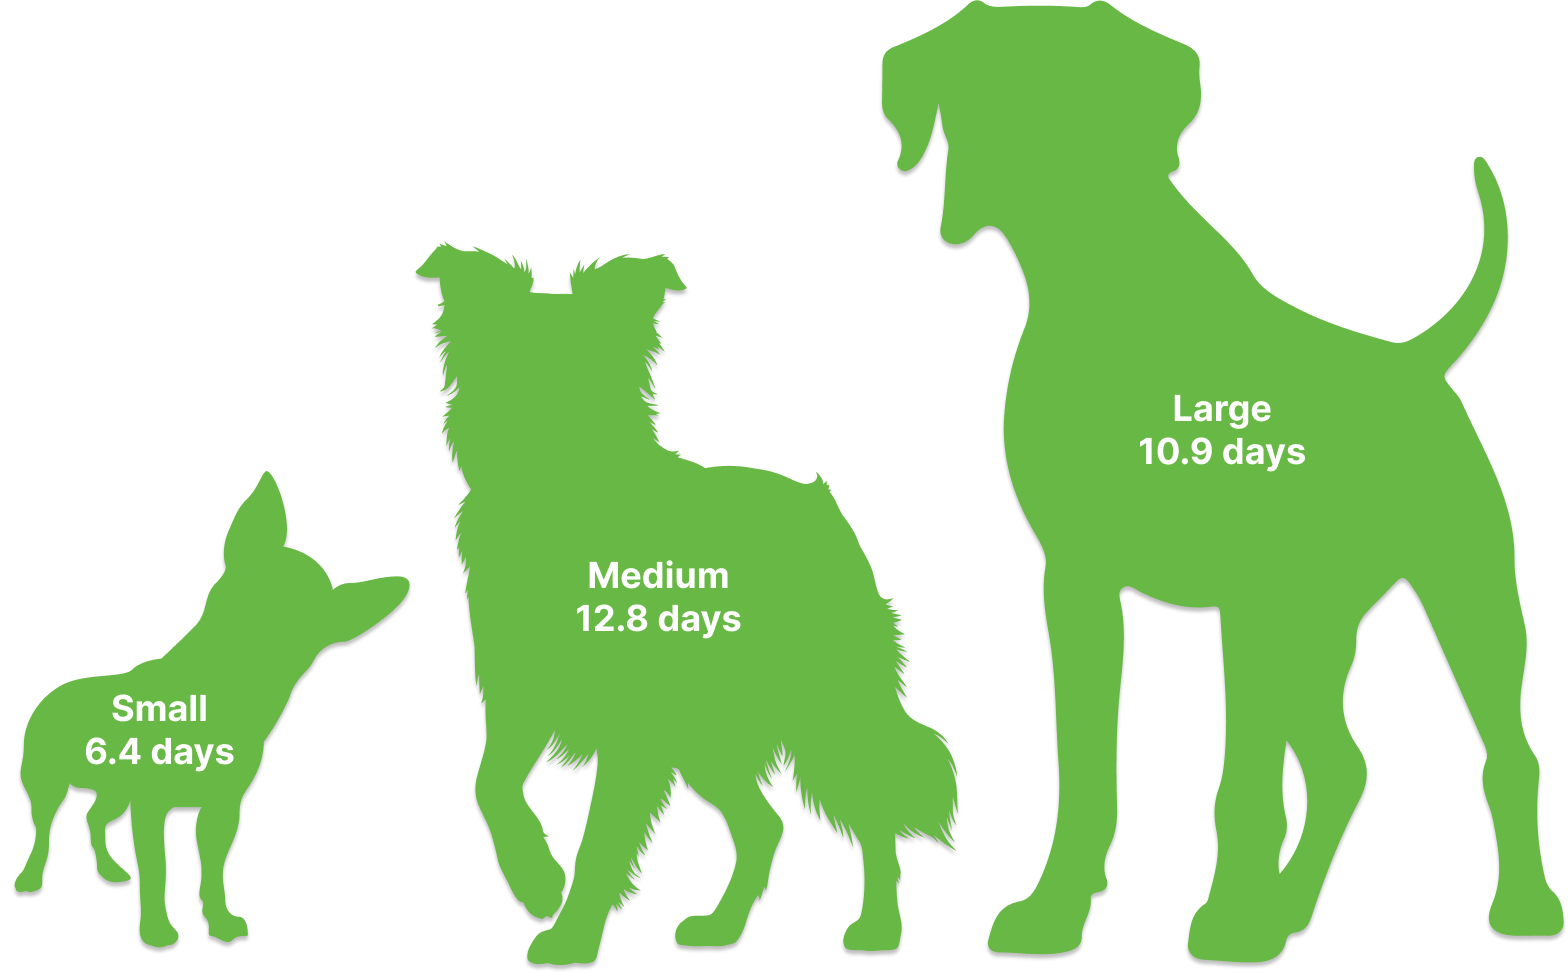
Large adult dogs continue to be the hardest to place with the slowest time to adoption (73% adoption rate and median TTA of 16 days) of all dog cohorts. In contrast, small puppies are the easiest to rehome, with 90.1% adoption rate and just 6.4 day median TTA, the best outcome of any age and size combination.
Adult dogs generally have the fastest time to first enquiry at 0.6 days median, despite being the slowest age cohort to be adopted. This is notable as adults attract initial interest quickly but listings then take longer to convert to adoptions, suggesting the screening and matching process is the bottleneck, not demand.
Aside from size and age, characteristics of the slowest-adopted dogs include:
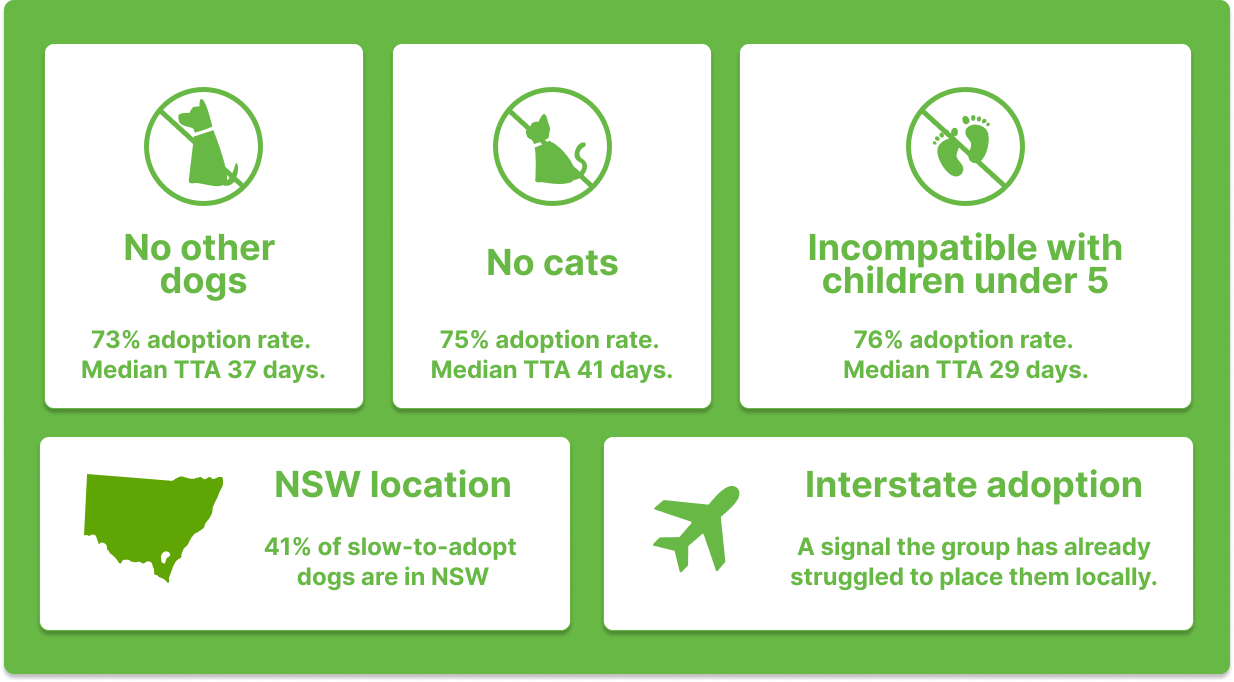
- 'No kids under 5' over-represented by 18% with a 76% adoption rate and median TTA of 29 days
- 'No cats' over-represented by 17% and at more than 3x the rate of the rest, with a median TTA of 41 days and adoption rate of 75%
- 'No dogs' over-represented by 5% and occurring at 3x the rate of other dog adoptions, with a 73% adoption rate and 37-day median TTA
- NSW location: 41.0% of slow dogs were in NSW vs 25.5% elsewhere
- Moderate policy rescue groups dominate slow adoptions at 56.3% of this cohort vs 36.5% of other dog adoptions
- Interstate adoptions are over-represented in slow-moving listings, as these dogs have been flagged for a wider audience, suggesting the group has already struggled to place them locally
Combined effect of dog size and age on adoption outcomes in 2025
Age drives adoption rate more than size. Within each size category, juveniles consistently have the highest adoption rate and the spread of data between age groups is consistent, with the gap between adult and puppy adoption rates being between 10 and 12%.
Size drives time to adoption more than age, and this relationship is especially notable for small dogs:
🐕 Small puppies rehome in 6.4 days while medium and large puppies take 12.8 and 10.9 days respectively
🐕 For adults, size matters less for TTA (10.0 vs 13.5 vs 15.8 days), suggesting that while small adults still find homes relatively quickly, adults of all sizes face longer waits
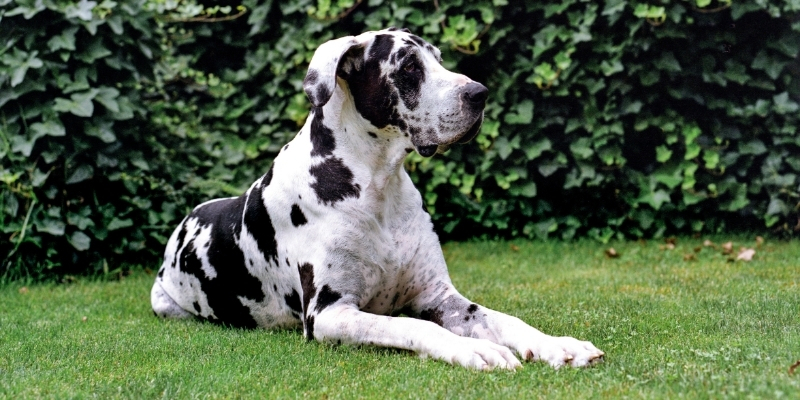
Consistent with last year's data, medium dogs are the largest cohort (13,328 listings, 51% of all dogs) but have middle-of-the-road outcomes across all age categories. The sheer volume of medium-sized dogs listed means even modest improvements in adoption outcomes would have a significant platform-wide impact.
Slow adoptions for medium and large sized dogs has also been reported internationally, with 2025 reports from Hill's Pet Nutrition and Shelter Animals Count both reporting that large dogs wait approximately 70% longer in shelters than small dogs. This has been linked to housing constraints and weight limits in rental properties in the US, and it appears that to some degree this is also playing a role in metropolitan areas within Australia.
Ongoing trends in young medium and large sized dogs
As noted in the 2024 State of Pet Adoption Report, young medium and large dogs, particularly medium-sized adolescents, are a cohort of particular concern due to decreasing adoption rates and increasing time to adoption.
In 2025, these trends accelerated for all four cohorts in this category, with the national adoption rate for medium-sized adolescent dogs falling to 84%. All cohorts of young medium and large dogs had an annual adoption rate of under 90% in 2025.
During the same period, time to adoption for all four cohorts of young medium and large dogs fell sharply in 2025. Alongside falling adoption rates, this indicates that young dogs in these cohorts are being removed from the platform for reasons other than adoption.
Falling adoption rates combined with falling time to adoption indicates that young medium and large dogs are increasingly being removed from the platform without being adopted.
Breakdown of removed puppy and adolescent listings by organisation type in 2025
In 2025, 837 puppy and adolescent dog listings were removed from the platform without being marked as rehomed. While some of these pets may have been transferred to other organisations or returned to their guardian, for others the outcome is unknown and potentially of concern.
By absolute count, shelters removed the most at 388 listings (212 puppies and 176 adolescents), followed by rescue groups at 284, and councils at 163. By removal rate, however, the picture flips:
🏛️ Councils have the highest removal rate for young dogs at 9.5% overall, driven heavily by adolescent dogs (11.4% removal rate)
🏢 Shelters are next at 8.1%, fairly even across puppies (8.0%) and adolescents (8.3%)
🏠 Rescue groups have the lowest removal rate at 3.3%
It is worth noting the different patterns by age cohort: for councils, adolescent dogs are removed at twice the rate of puppies (11.4% vs 5.7%). Shelters remove both cohorts at roughly the same rate (approximately 8%). Rescue groups also see a slightly higher removal rate for adolescents (4.2% vs 2.9%).
Other pets
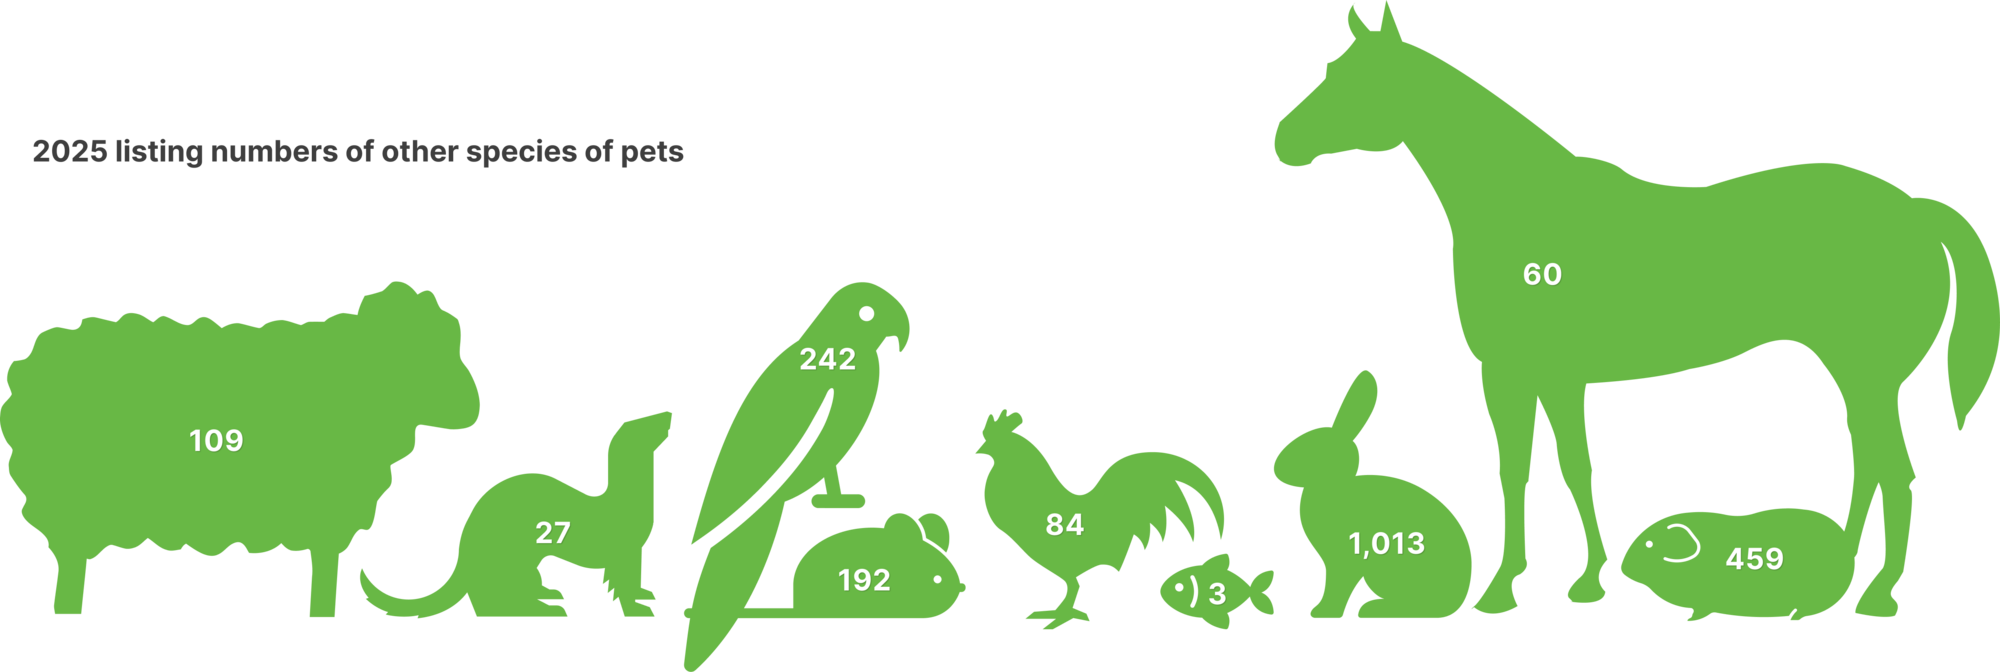
*Note: Due to the small numbers and prolonged times to adoptions for other species of pets, a number of adoptions occurred in 2025 for pets listed in previous years, resulting in adoption rates above 100% for some species
Do pets of other species fare better in different types of adoption organisations?
The 'other pets' segment (rabbits, guinea pigs, birds, etc.) is much smaller at 2,489 total listings, but the same structural patterns hold. The shelter vs rescue group divide is even more pronounced for other pets than for cats and dogs:
🏢 Shelters: 88.7% adoption rate, 6.8-day median TTA (1,515 listings)
🏠 Rescue groups: 64.1% adoption rate, 30.0-day median TTA (927 listings) with more enquiries than adoptions (966 vs 594), suggesting other species are harder to place through rescue groups
🏛️ Councils handle very few other species (44 listings), consistent with animal management legislation being restricted to dogs and cats, but rehome them quickly (median 4.2 days)
Species-specific patterns worth noting
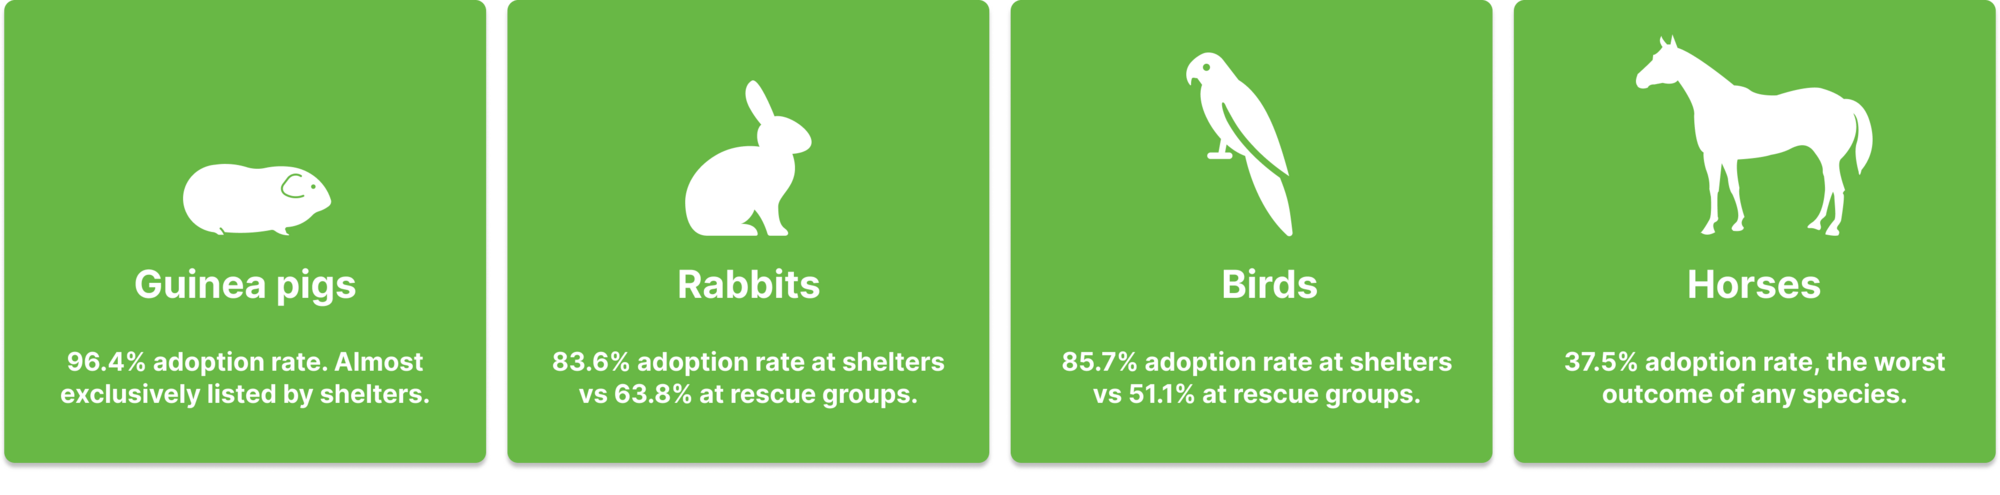
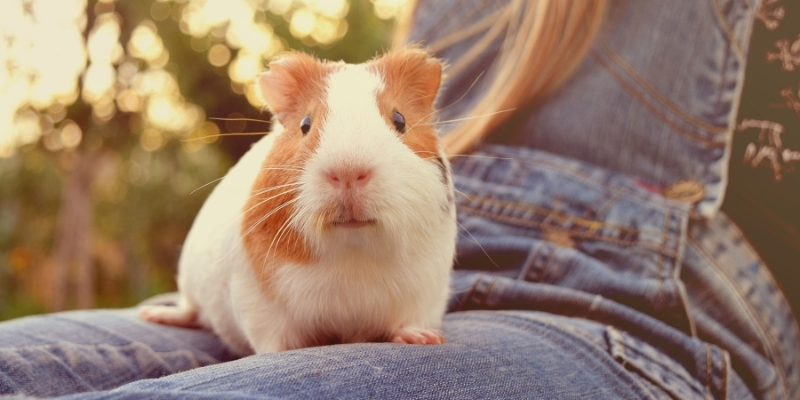
🐹 Guinea pigs are overwhelmingly a shelter species (672 of 759 listings, 89%) with a 96.4% adoption rate at shelters
🐰 Rabbits are more evenly split: 562 at shelters (83.6% adoption rate) vs 437 at rescue groups (63.8% adoption rate). Rescue group rabbits are the single largest underperforming cohort in the other pets category
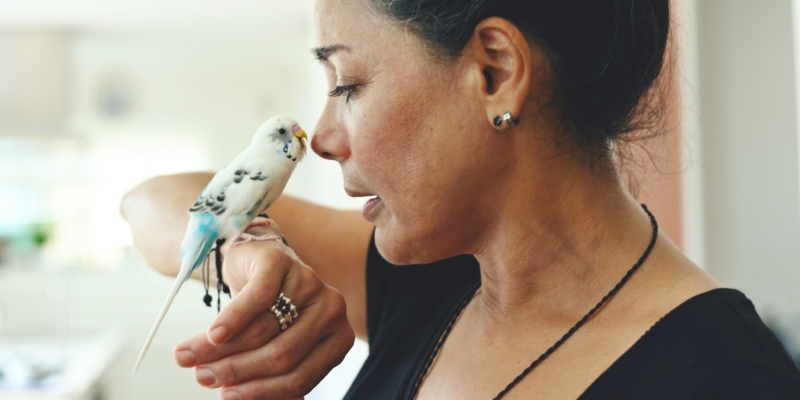
🐦 Birds at rescue groups have only a 51.1% adoption rate (178 listings), vs 85.7% at shelters (63 listings). Bird rescue is a significant area of concern
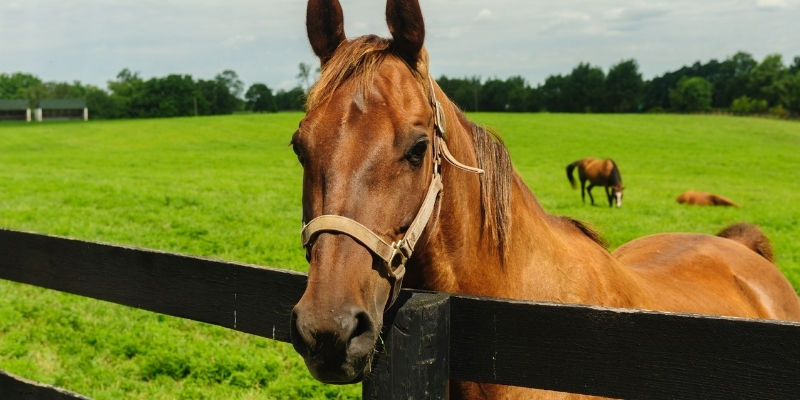
🐴 Horses are almost entirely shelter-listed (56 of 60) with a 37.5% adoption rate, by far the worst outcome at shelters for any species
The shelter vs rescue group divide is even more pronounced for other pets than for cats and dogs, with shelters achieving an 88.7% adoption rate compared to 64.1% for rescue groups.
Trends in other pet species over time
🐦 Bird listings nearly doubled from 139 (2024) to 242 (2025), with adoption rates dropping from 87.8% to 67%, indicating that listing increases outpaced demand
🐴 Horses are the worst-performing species with notable numbers in 2025, with an adoption rate of 65% and 17.6-day median TTA. This is a decline from 79-95% adoption rates in earlier years
🐰 Rabbits remain the most consistent high-volume species (approximately 830-1,080 per year)
🐔 Chicken listings have grown steadily from 18 (2020) to 64 (2025), with strong adoption rates (92.2%)
🐭 Rats similarly scaled from single digits in 2020 to 48 listings in 2025, with a strong 91.7% adoption rate. Note: mouse listings in 2025 were abnormally high, likely due to a single or small number of large-scale pet mice intakes
Bird listings nearly doubled in 2025 while adoption rates dropped from 87.8% to 67%, and horse adoption rates declined from 79-95% in earlier years to just 65% in 2025, making these two species areas of growing concern.

Jump to specific insights from the report:
Images: Canva, unless captioned otherwise.