


A section with key insights from State of Pet Adoption Platform Insights 2025
State profiles
Adoption outcomes can vary significantly by state, with members experiencing different influences such as legislation, geography, transport challenges and local demand. These factors also shape how councils, shelters, rescues and veterinary professionals work together, contributing to distinct sector dynamics across each state. Analysing data at a state level helps identify specific challenges and opportunities, supporting more targeted collaboration and advocacy to better support members.
The following trends were noted across the full dataset from July 2019 to December 2025:
VIC and NSW were the only states with a significant council presence (16 to 17% of listings). Everywhere else, the market is split between shelters and rescue groups.
NSW has the most balanced cat and dog split across group types, reflecting its more diverse group ecosystem.
QLD has the strongest shelter presence (55% of listings) and the highest adoption rate of any state and group combination (97.8%), driven largely by very fast cat rehoming (median 2.8 days). Rescue groups account for 45% of listings, with almost no council activity.
Representation of adoptable pets on PetRescue is highly skewed in several other states:
- TAS is almost entirely shelter driven (98% of listed pets).
- SA is almost entirely rescue group driven (96% of listed pets), with 87% of listings being cats.
- NT has a split market, with shelters accounting for 68% of dog listings, while rescue groups dominate cat listings. The single NT rescue group lists almost exclusively cats (99.4% cats).
- ACT is by far the most dog skewed state, with 81% of listings being dogs, almost entirely from rescue groups.
Focusing on each state individually, outcomes for 2025 and specific trends from the 2019 to 2025 data that impact adoptions within the state are explored below.
Note: Only states with representative membership and sufficient data for robust statistical analysis were included in the deeper analysis.
Jump to: ACT | NSW | NT | QLD | SA | TAS | VIC | WA

Australian Capital Territory
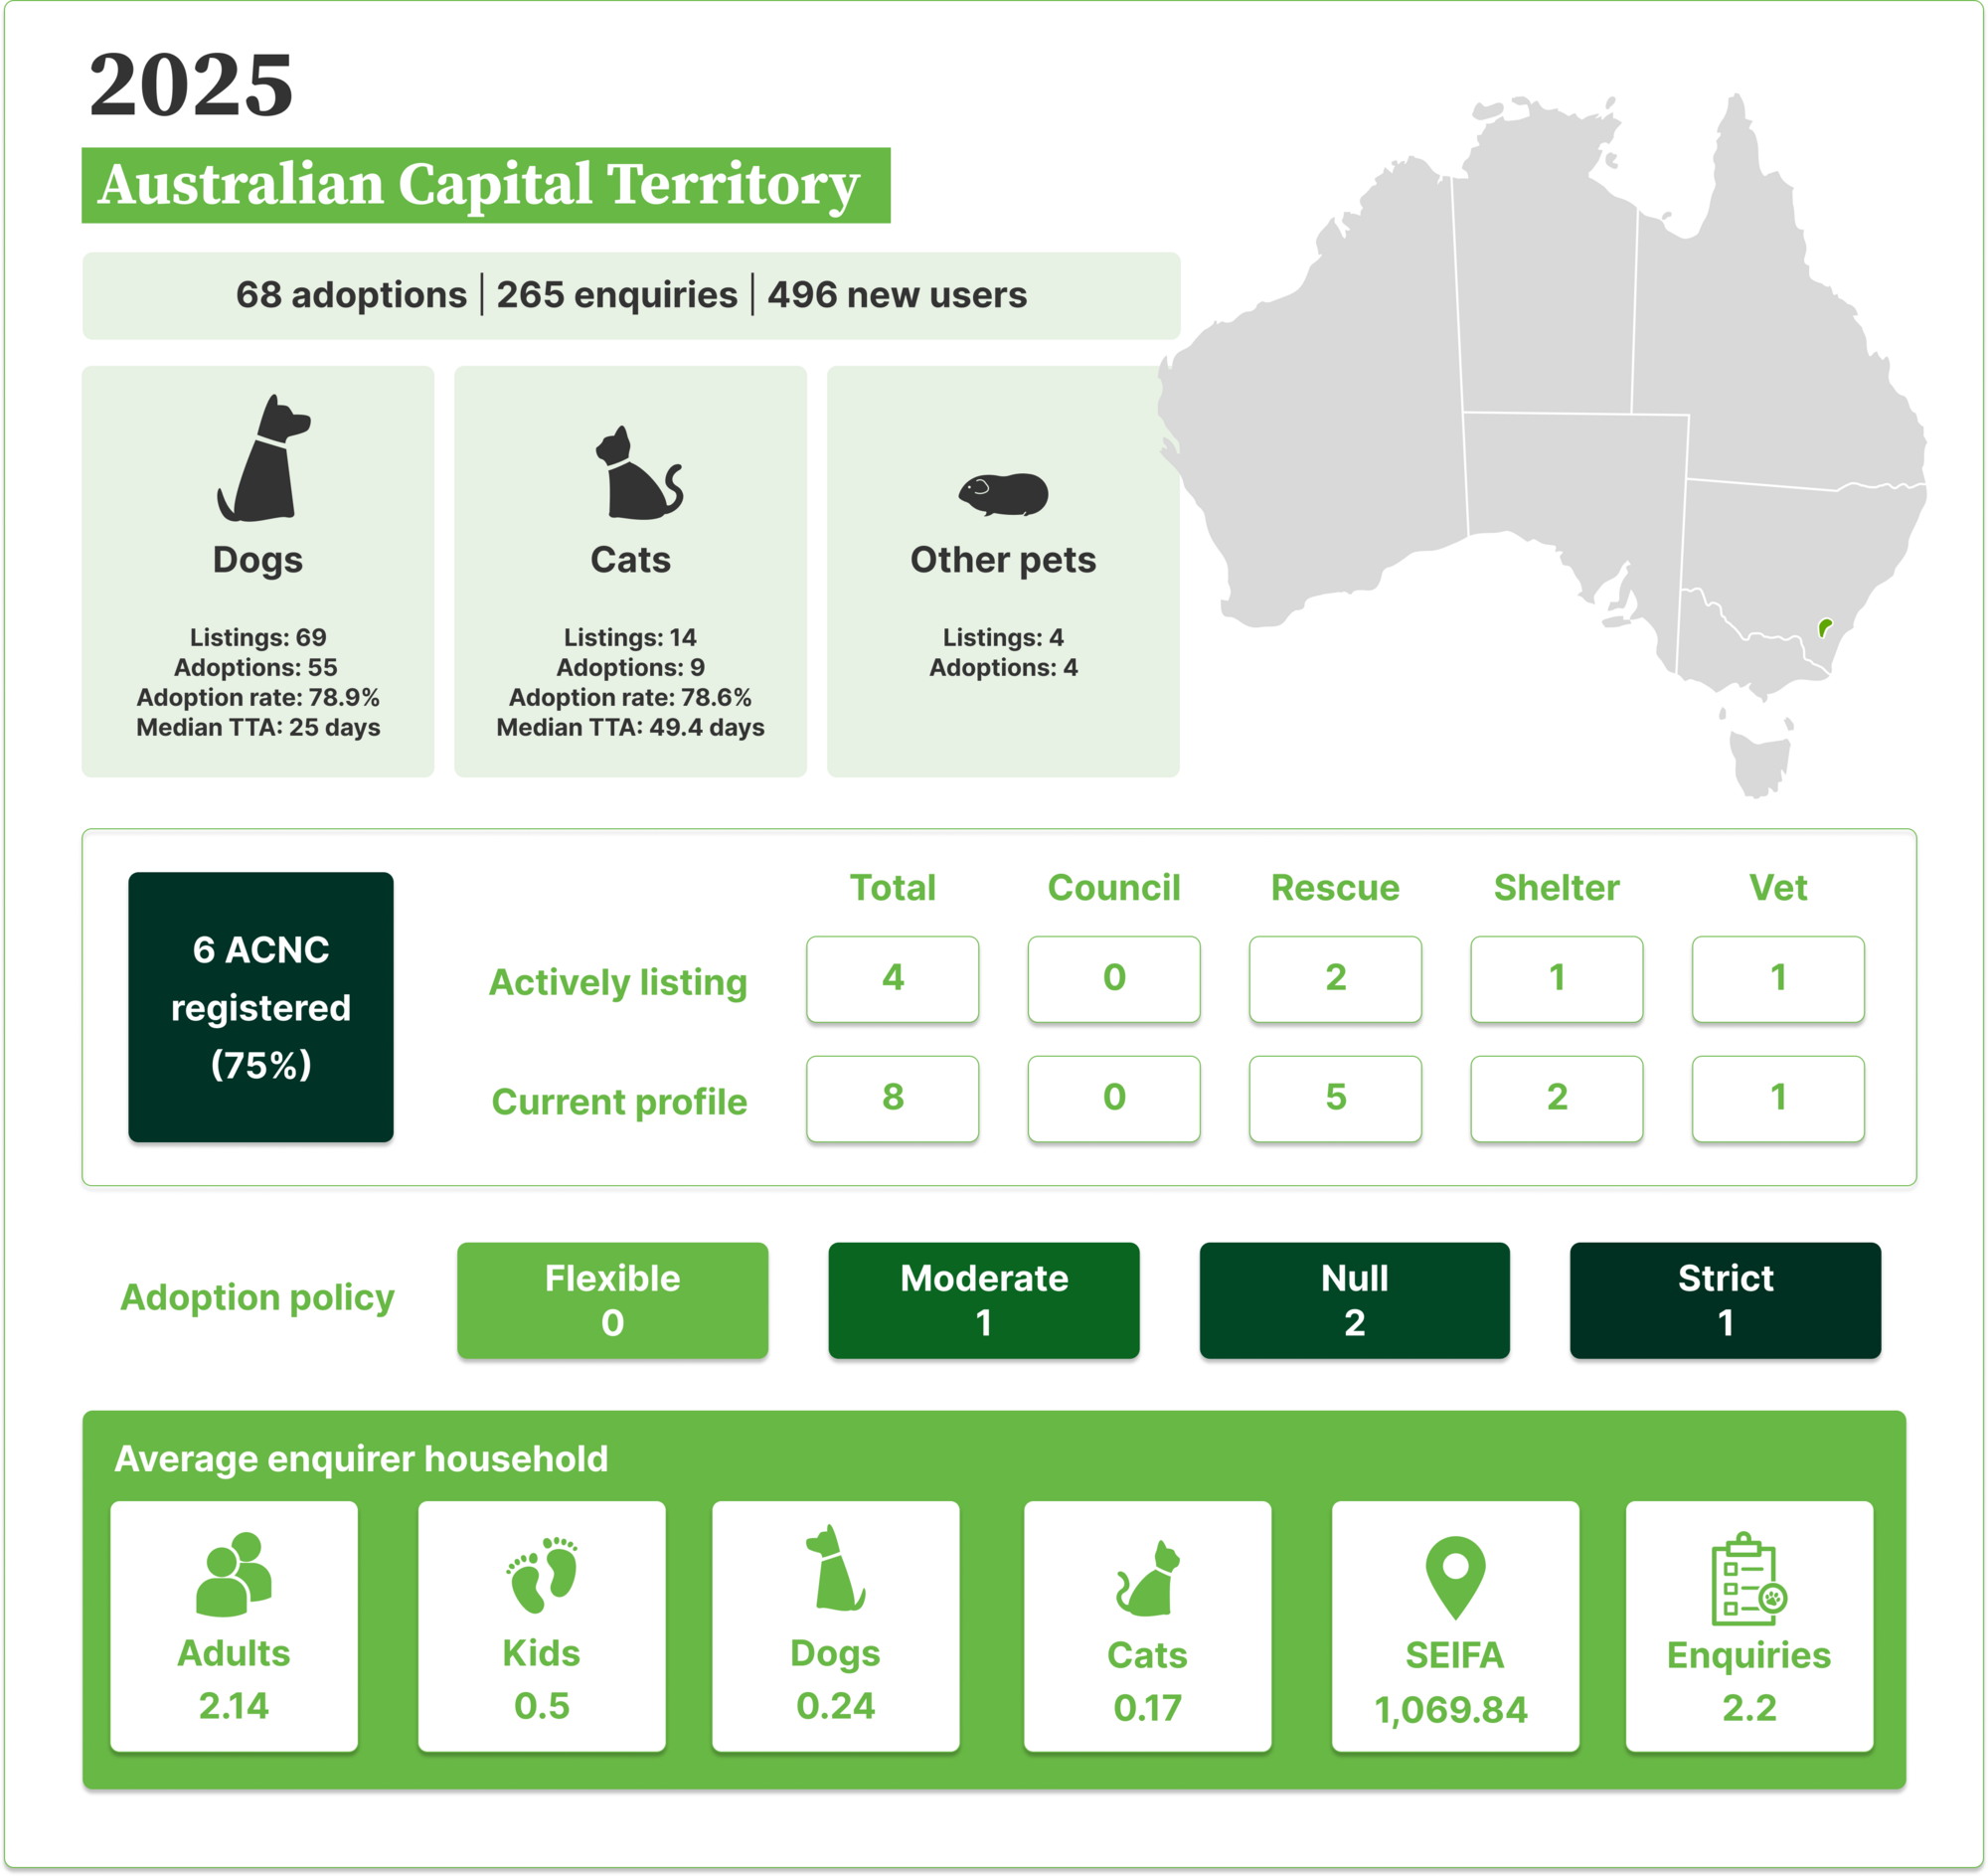
In 2025, 68 pets were adopted via PetRescue in the ACT, with 265 enquiries submitted and 496 new users created.
🐱 Cat listings: 14 | Adoptions: 9 | Adoption rate: 78.6% | Median TTA: 49.4 days
🐶 Dog listings: 69 | Adoptions: 55 | Adoption rate: 78.9% | Median TTA: 25 days
🐾 Other listings: 4 | Adoptions: 4
4 member organisations were actively listing pets in the ACT, made up of 2 rescue groups, 1 shelter and 1 vet clinic. Of the 8 current ACT member profiles, 6 are registered charities with the Australian Charities and Not-for-profits Commission (ACNC), representing 75% of ACT membership.
Of the 4 actively listing members, adoption policy breakdown was as follows: 1 moderate, 2 with no policy selected and 1 strict. No ACT members currently operate with a flexible adoption policy.
From the overall dataset (2019-2025), 3,523 users were active in the ACT, of which 1,483 (42%) were repeat users. 203 user profiles submitted no enquiries.
The average ACT enquirer household contained 2.14 adults, 0.5 kids, 0.24 dogs and 0.17 cats, with a SEIFA Score of 1,069.84, submitting an average of 2.2 enquiries.
New South Wales
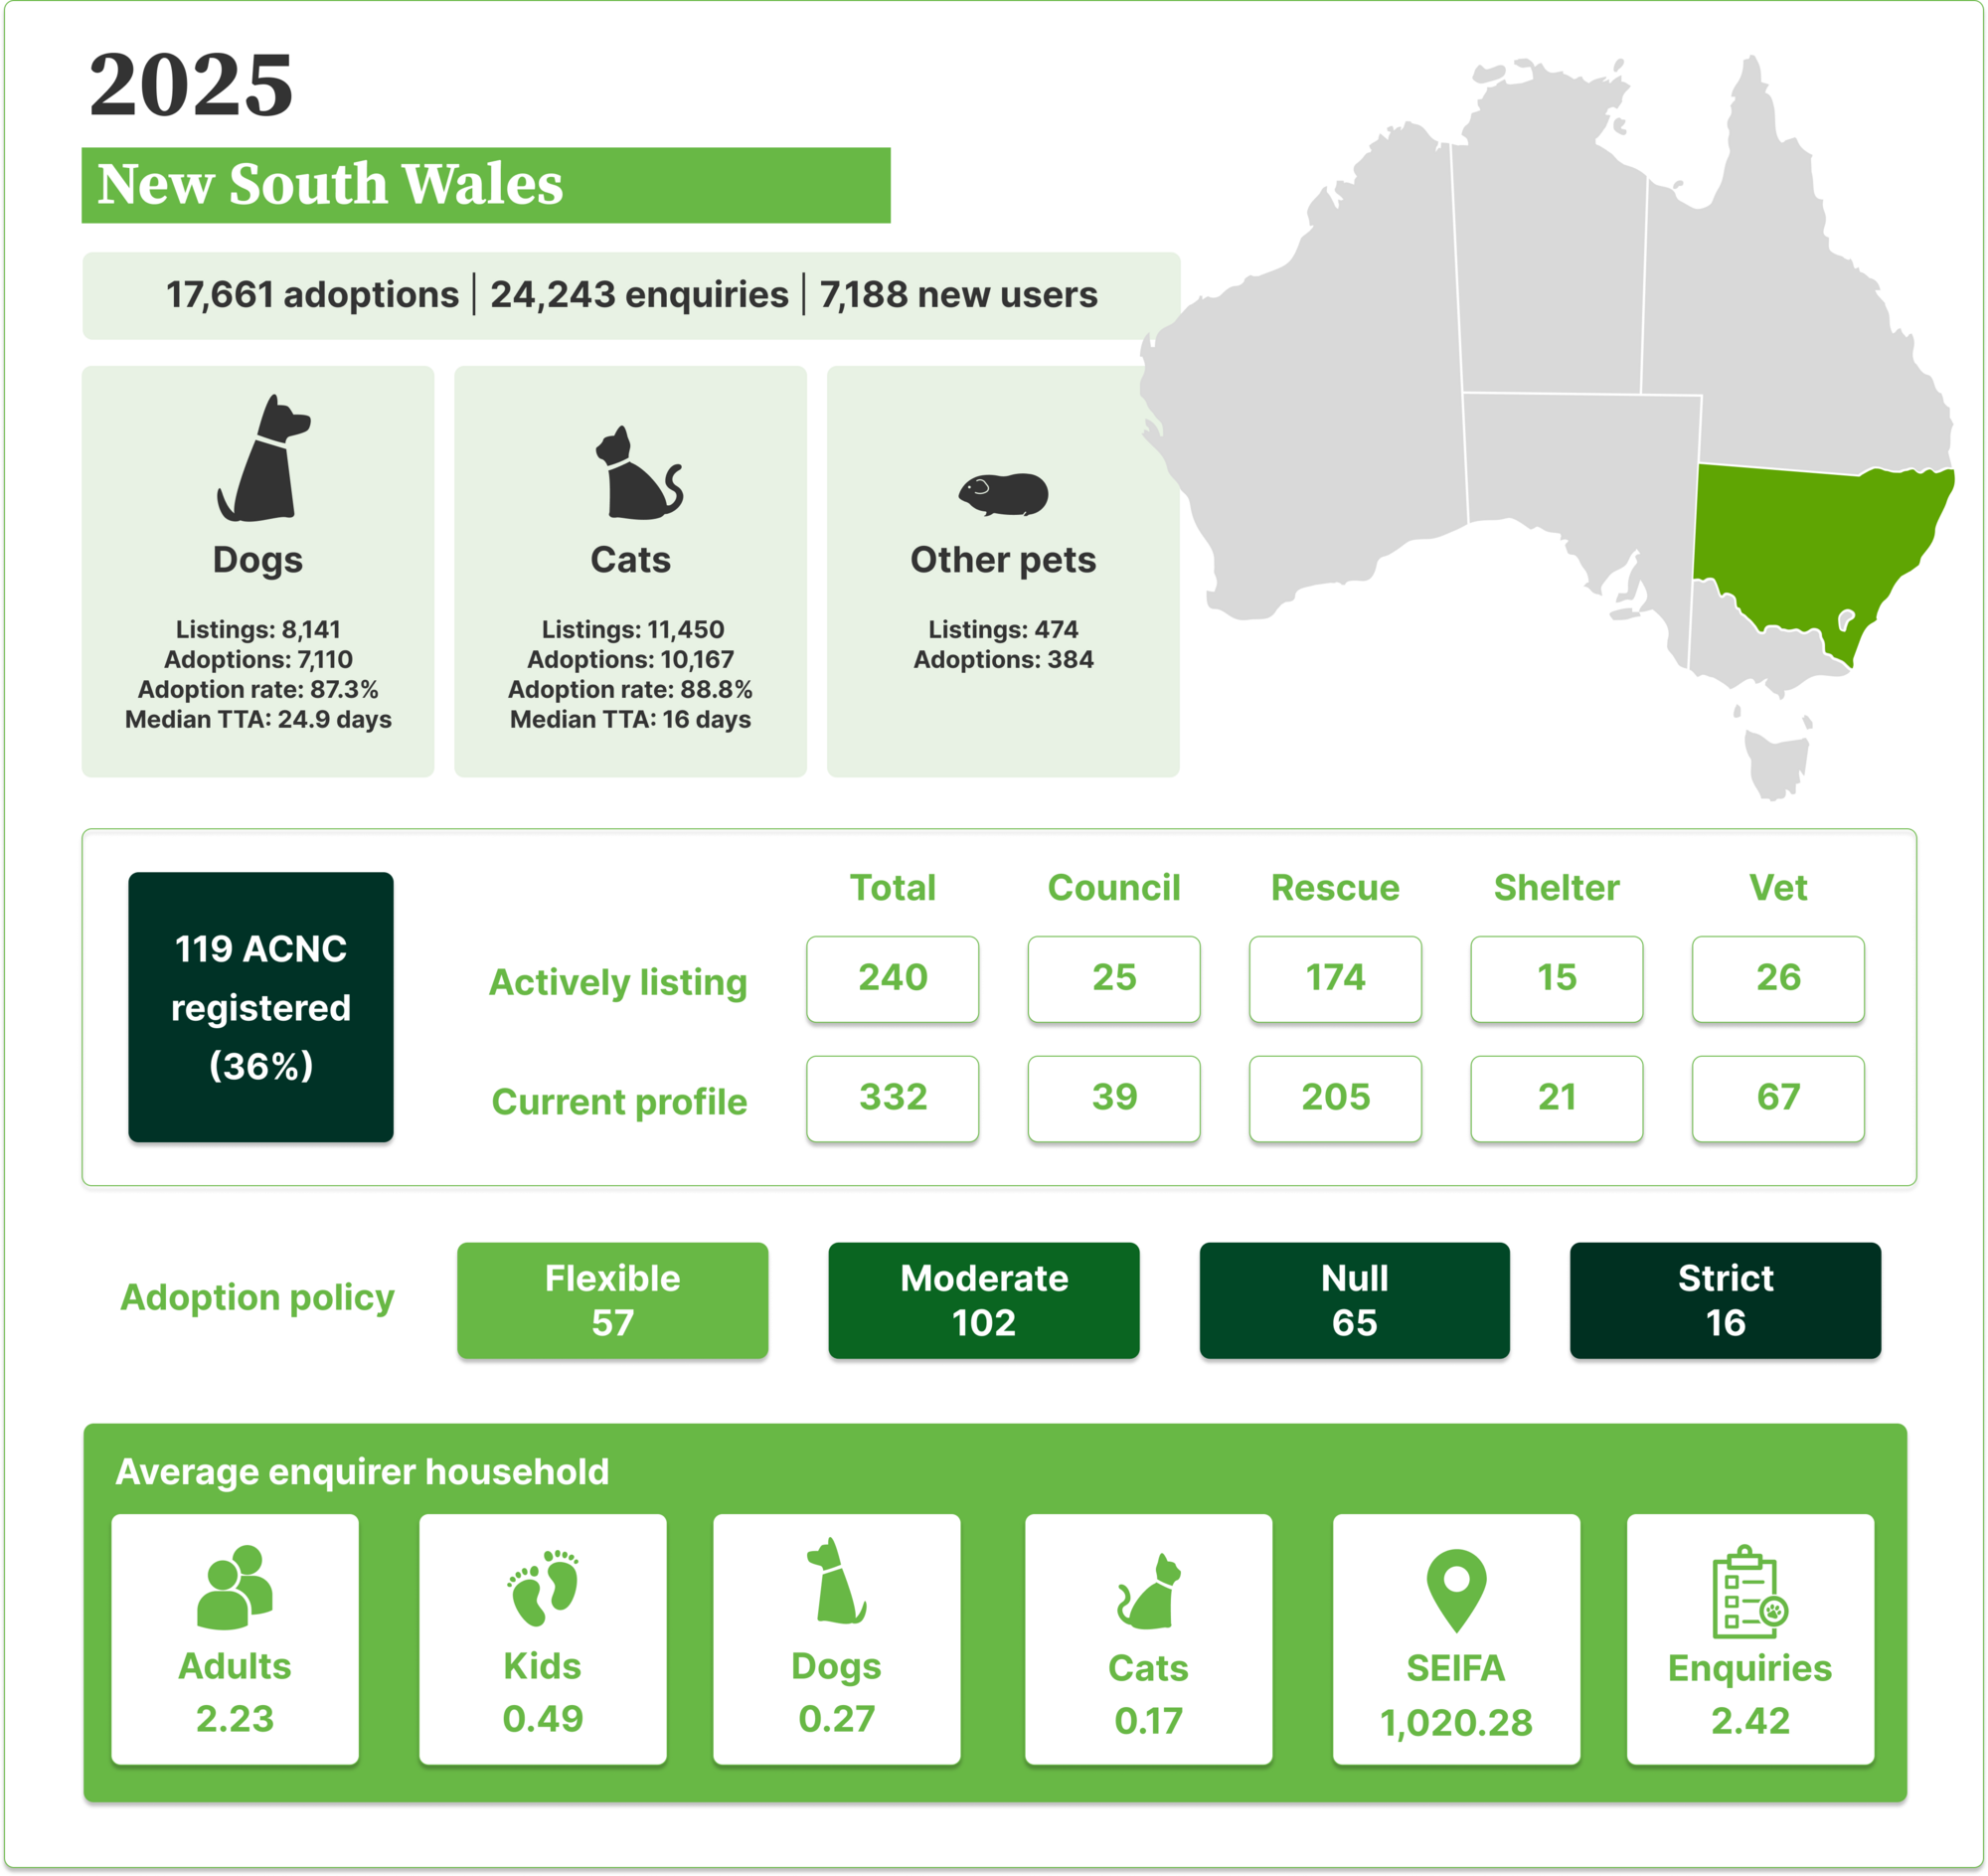
In 2025, 17,661 pets were adopted via PetRescue in NSW, with 24,243 enquiries submitted and 7,188 new users created.
🐱 Cat listings: 11,450 | Adoptions: 10,167 | Adoption rate: 88.8% | Median TTA: 16 days
🐶 Dog listings: 8,141 | Adoptions: 7,110 | Adoption rate: 87.3% | Median TTA: 24.9 days
🐾 Other listings: 474 | Adoptions: 384
240 member organisations were actively listing pets in NSW, made up of 25 councils, 174 rescue groups, 15 shelters and 26 vet clinics. Of the 332 current NSW member profiles, 119 are registered charities with the Australian Charities and Not-for-profits Commission (ACNC), representing 36% of NSW membership.
Of the 240 actively listing members, adoption policy breakdown was as follows: 57 flexible, 102 moderate, 65 with no policy selected and 16 strict.
From the overall dataset (2019-2025), 61,449 users were active in NSW, of which 28,105 (46%) were repeat users. 3,716 user profiles (6%) submitted no enquiries.
The average NSW enquirer household contained 2.23 adults, 0.49 kids, 0.27 dogs and 0.17 cats, with a SEIFA Score of 1,020.28, submitting an average of 2.42 enquiries.
Following significant changes to typical pet listing and adoption patterns during the COVID pandemic, pet listings and adoptions in NSW have grown steadily since 2022, with listings up 37% from 2019 to 2025. Enquiries stabilised around 23,000-24,000 per year from 2023 onwards.
Concerningly, listing removals have risen sharply, more than doubling from 966 (2019) to 2,441 (2025), with a particularly steep increase in 2025 (+70% year-on-year). This coincides with falling adoption rates and changes to TTA in NSW, which based on PetRescue data appears to be the state that was first impacted by weakening adoption demand and falling adoption rates.
At national level, falling adoption rates in dogs have been somewhat obscured by high adoption rates in cats, especially from Victoria. NSW members list comparatively more dogs than cats, a dog to cat ratio of 0.71, compared to the rest of the country which combined has a dog to cat ratio of 0.52.
NSW dog adoption metrics for 2025 paint a concerning picture, with median TTA for dogs of all sizes being between 1.8 to 2.5 times longer than the rest of the country. Small dogs elsewhere are adopted in about a week while in NSW it takes nearly three weeks. For large dogs in particular, the average TTA is particularly concerning at 103.3 days vs 51 days for the rest of the country, indicating that large dogs are having an especially hard time finding adoption placements in NSW.
NSW dog median TTA is 1.8 to 2.5 times longer than the rest of the country. Small dogs that take a week to adopt elsewhere take nearly three weeks in NSW.
When examining 2025 listing removals from NSW, cats and dogs are approximately equally represented and NSW shelters are responsible for slightly over 70% of removals. Noting that most shelters use population management software integrations with the platform, this indicates that these pets are true removals with outcomes other than adoption. While councils are responsible for only 12.5% of removals, these are highly skewed towards dogs (224 dogs to 82 cats), likely because few councils in NSW provide cat management services.
As of the end of 2025, NSW was the only state impacted by falling adoption rates severely enough and for long enough that this is evident in all species, annual adoption rate and listing removals.
65% of NSW member organisations are located in and around a major city, a slight over-representation compared to national trends. 71% of enquirers are located in and around major cities, slightly less than the national trend. These slight variations in location of pets, groups and enquirers don't fully explain the significant differences observed in NSW pet adoption trends compared to the rest of the country. It is more likely that housing and cost of living pressures for NSW residents, and especially those in Greater Sydney, are impacting their pet ownership choices. Notably, for guardians with dogs, Sydney is generally the most difficult city in Australia to secure rental housing, followed by Melbourne, due to a combination of high competition, limited pet-friendly properties, and landlord selectivity.
Northern Territory
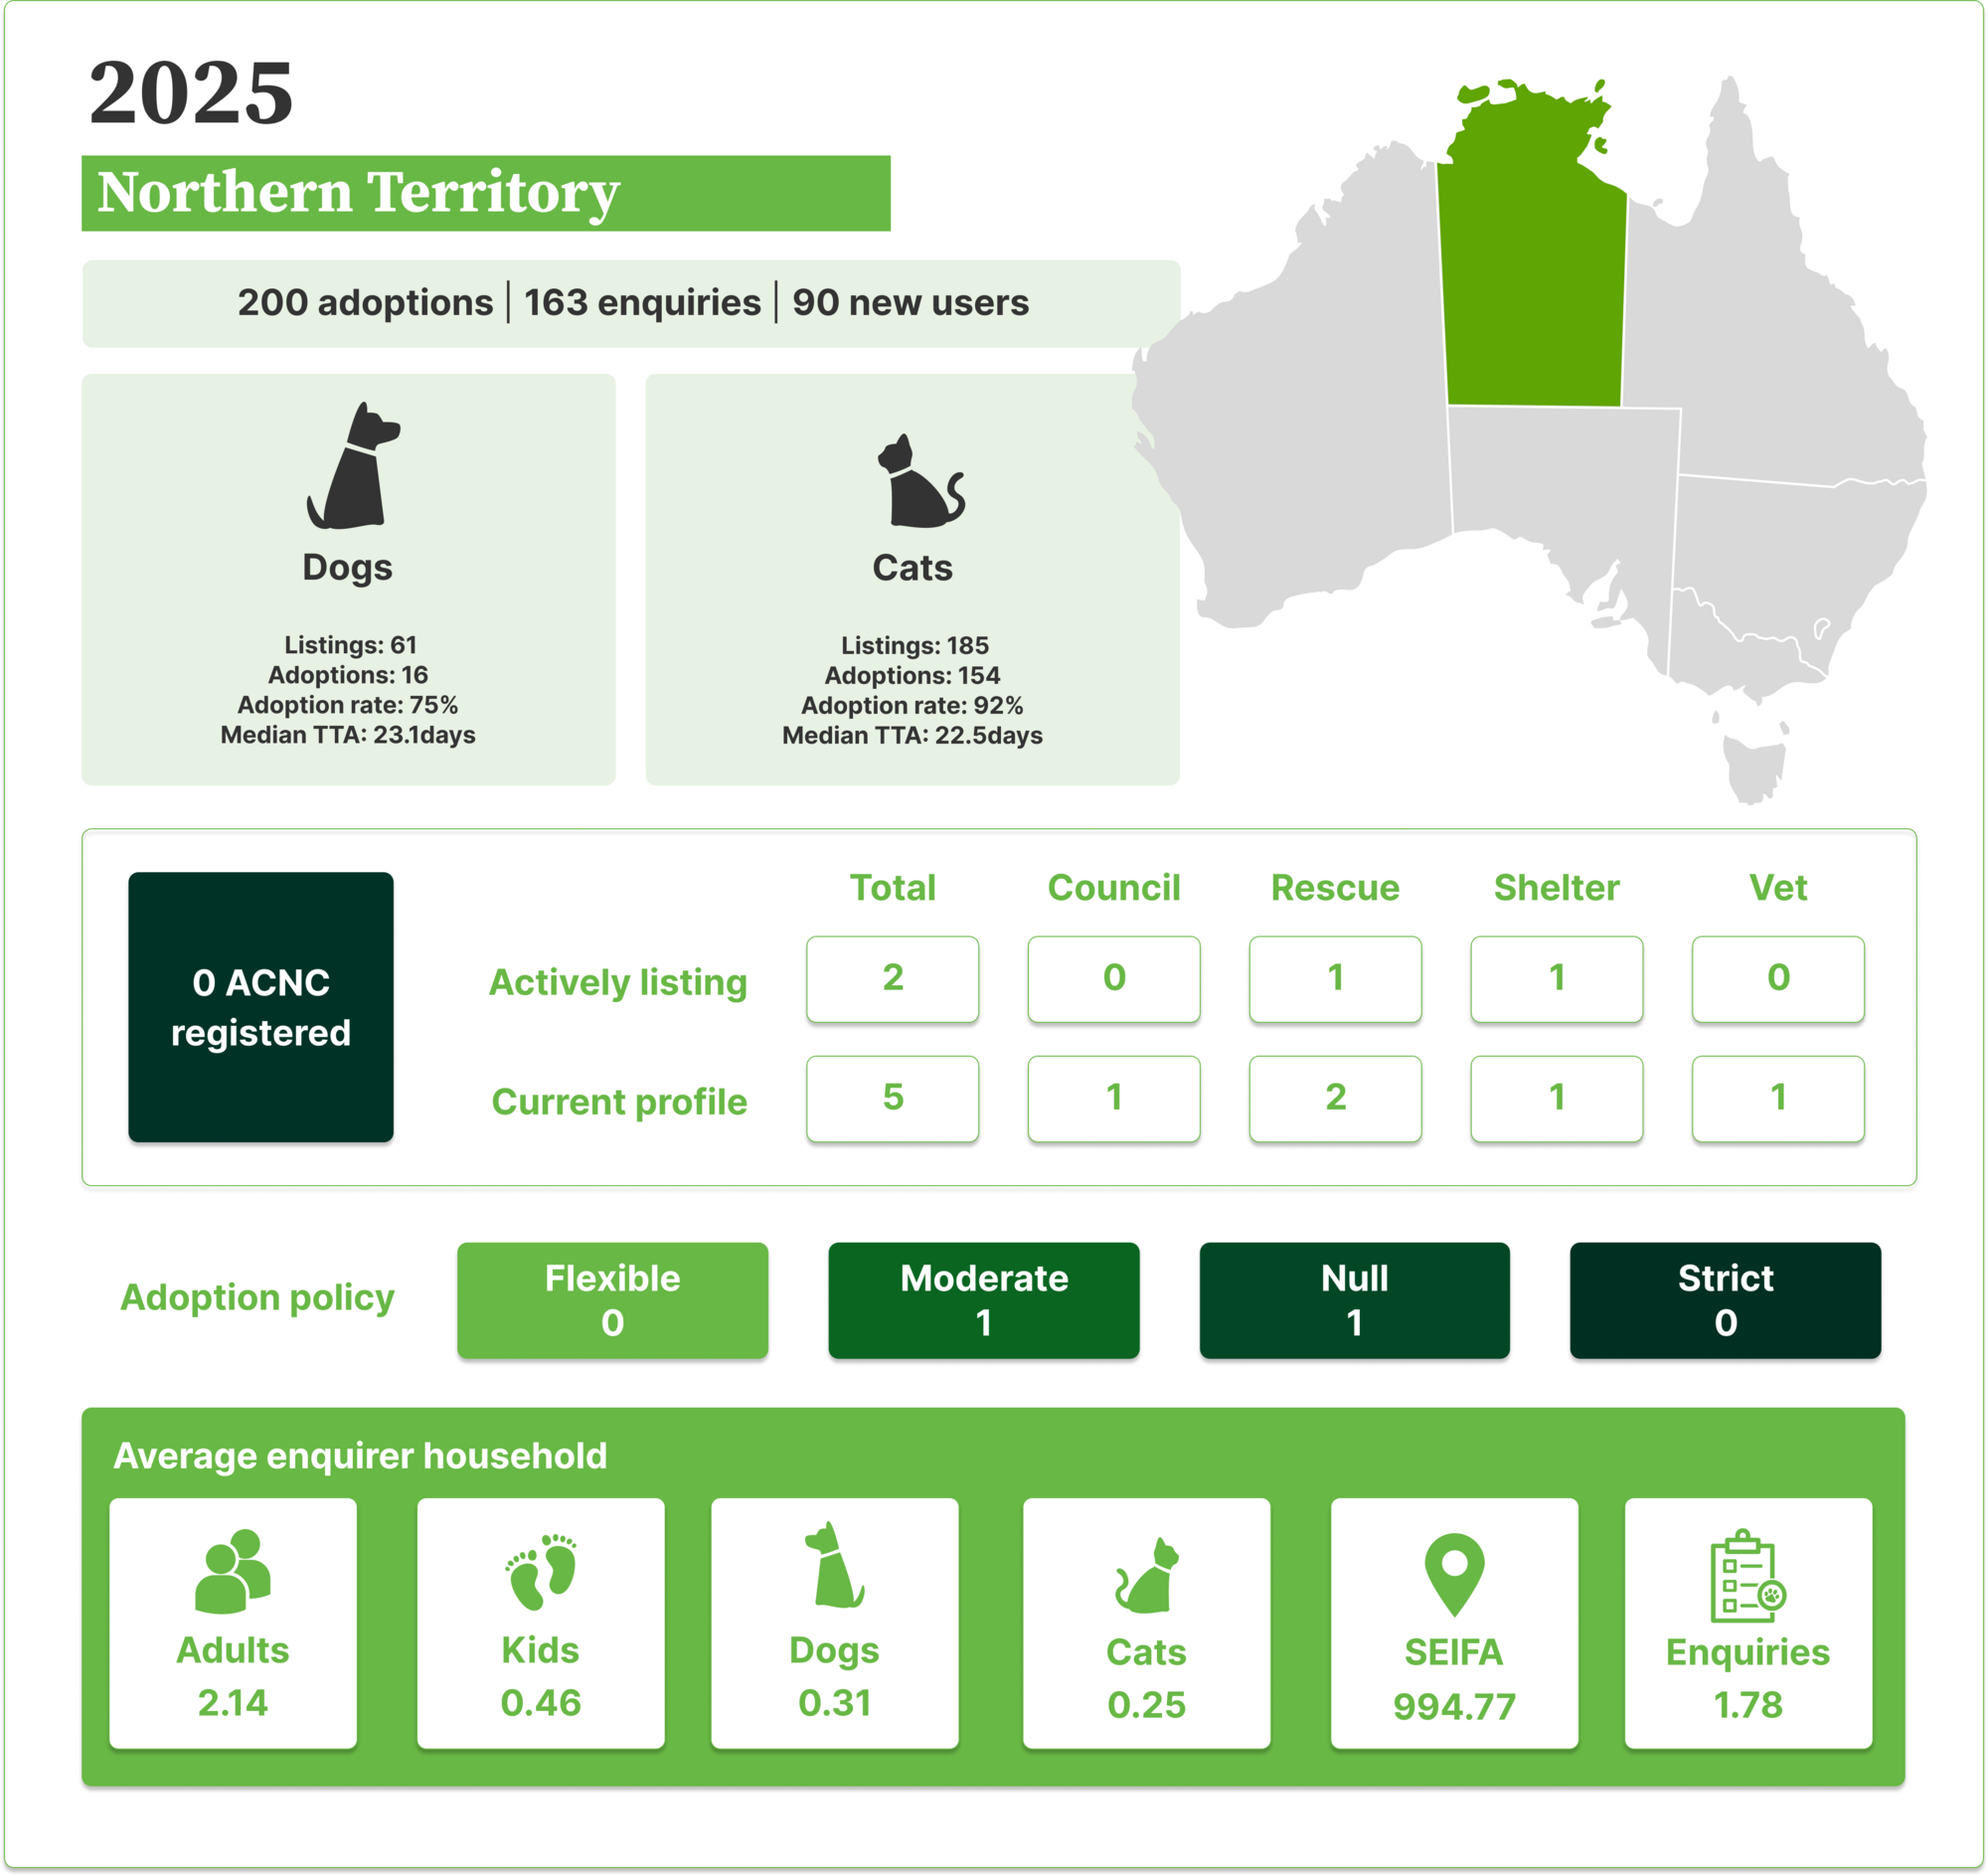
In 2025, 200 pets were adopted via PetRescue in the NT, with 163 enquiries submitted and 90 new users created.
🐱 Cat listings: 185 | Adoptions: 154 | Adoption rate: 92% | Median TTA: 22.5 days
🐶 Dog listings: 61 | Adoptions: 46 | Adoption rate: 75% | Median TTA: 23.1 days
2 member organisations were actively listing pets in the NT, made up of 1 rescue group and 1 shelter. Of the 5 current NT member profiles, no members are registered charities with the Australian Charities and Not-for-profits Commission (ACNC).
Of the 2 actively listing members, adoption policy breakdown was as follows: 1 moderate and 1 with no policy selected. No NT members currently operate with a flexible or strict adoption policy.
From the overall dataset (2019-2025), 614 users were active in the NT, of which 289 (47%) were repeat users. 46 user profiles submitted no enquiries.
The average NT enquirer household contained 2.14 adults, 0.46 kids, 0.31 dogs and 0.25 cats, with a SEIFA Score of 994.77, submitting an average of 1.78 enquiries.
Queensland
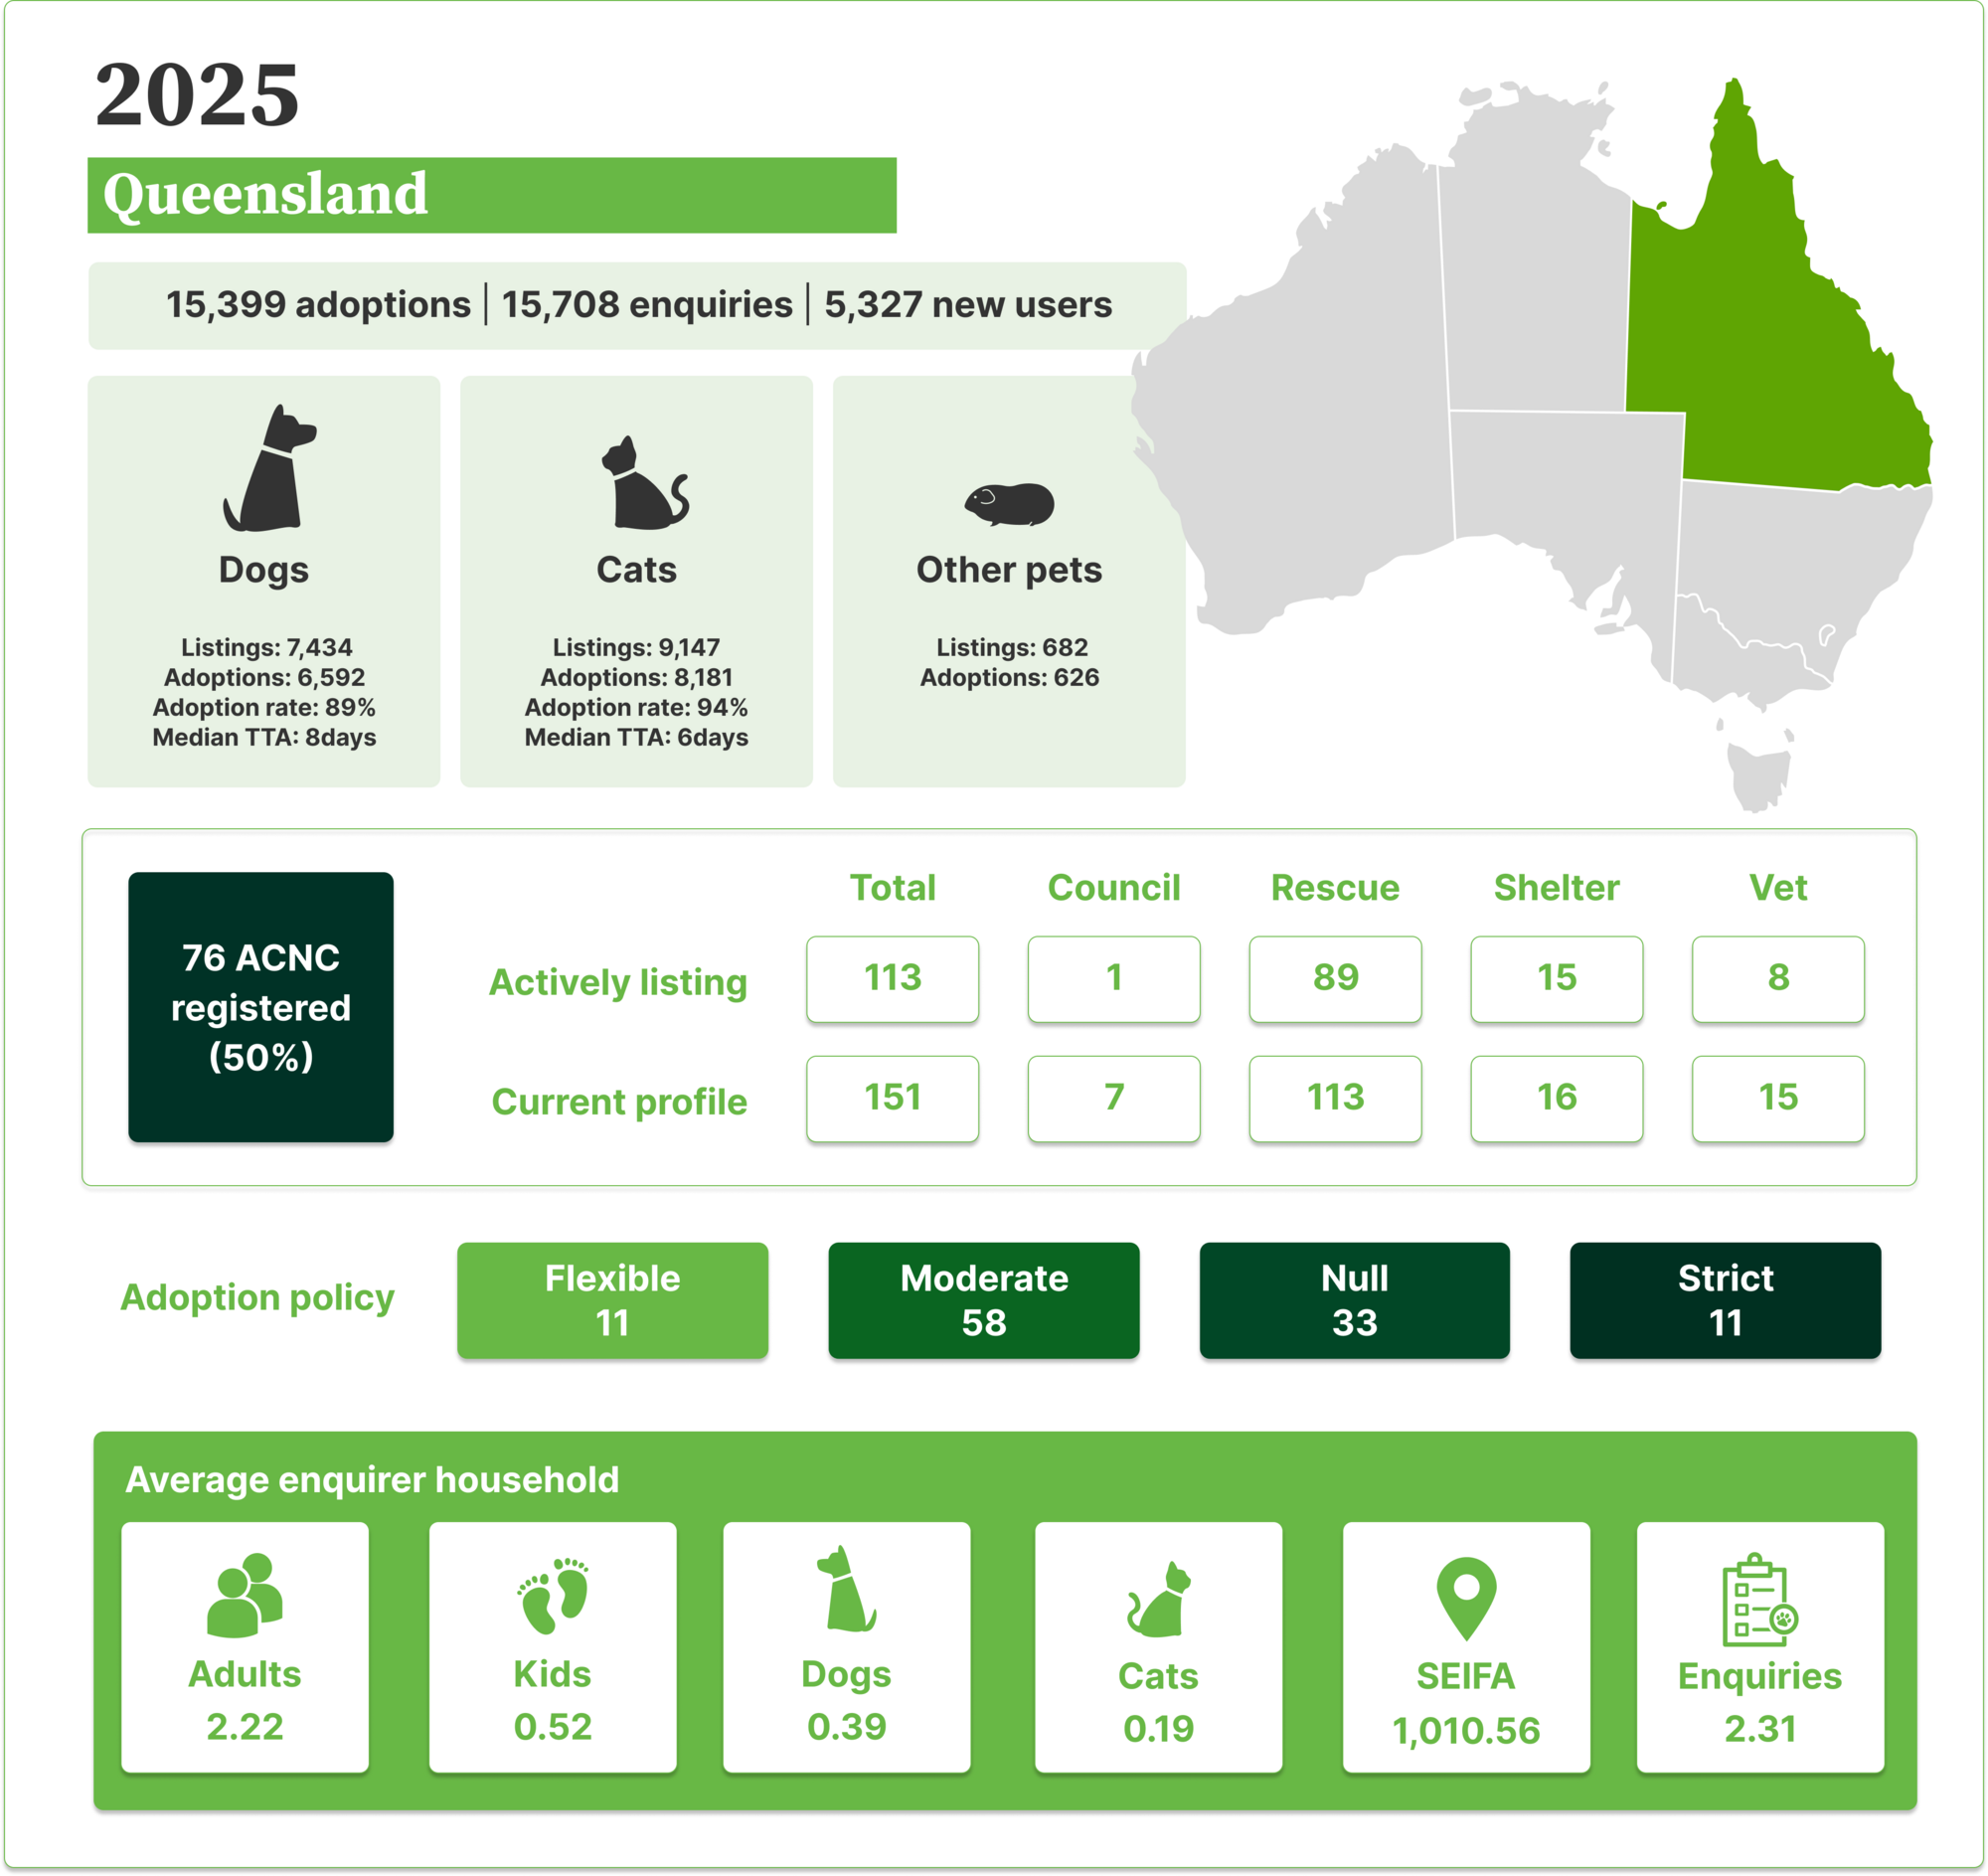
In 2025, 15,399 pets were adopted via PetRescue in QLD, with 15,708 enquiries submitted and 5,327 new users created.
🐱 Cat listings: 9,147 | Adoptions: 8,181 | Adoption rate: 94% | Median TTA: 6 days
🐶 Dog listings: 7,434 | Adoptions: 6,592 | Adoption rate: 89% | Median TTA: 8 days
🐾 Other listings: 682 | Adoptions: 626
113 member organisations were actively listing pets in QLD, made up of 1 council, 89 rescue groups, 15 shelters and 8 vet clinics. Of the 151 current QLD member profiles, 76 are registered charities with the Australian Charities and Not-for-profits Commission (ACNC), representing 50% of QLD membership.
Of the 113 actively listing members, adoption policy breakdown was as follows: 11 flexible, 58 moderate, 33 with no policy selected and 11 strict.
From the overall dataset (2019-2025), 44,649 users were active in QLD, of which 20,937 (47%) were repeat users. 2,887 user profiles submitted no enquiries.
The average QLD enquirer household contained 2.22 adults, 0.52 kids, 0.39 dogs and 0.19 cats, with a SEIFA Score of 1,010.56, submitting an average of 2.31 enquiries.
QLD listings dropped from 21,553 (2019) to a low of 13,564 (2023) before rebounding to 17,263 in 2025, still below 2019 levels. Similar to other states, enquiries stabilised from 2023 onwards, at 15,700 in 2025. Adoptions closely track listings year on year, with QLD maintaining a consistently high adoption rate in the mid-90s.
Listing removals have trended downward from 571 in 2019 to 271 in 2025, a positive sign for QLD's rescue sector.
Despite all species annual totals being strong for QLD through the entire dataset, the monthly adoption rate for dogs and cats had also started falling as of December 2025, with dogs sitting at 67% and cats at 74% at the turn of the new year.
Despite strong annual totals, monthly adoption rates for dogs and cats were already falling by December 2025, with dogs at 67% and cats at 74%.
Only 47% of member organisations in QLD are located in metro areas, compared to approximately 60% nationally, with more members located in regional centres than in other states. 75% of PetRescue account holders are located in metropolitan areas, in line with national patterns. Of the three main eastern states, Queensland has the most distributed population with approximately equal split of residents between metropolitan areas and the rest of the state, compared to 66% in NSW and 77% in Victoria. As most dog owners live outside major metropolitan areas, it may be that QLD's slowness to show falling dog adoption rates is largely attributable to a higher number of potential dog adopters living outside the city.
South Australia
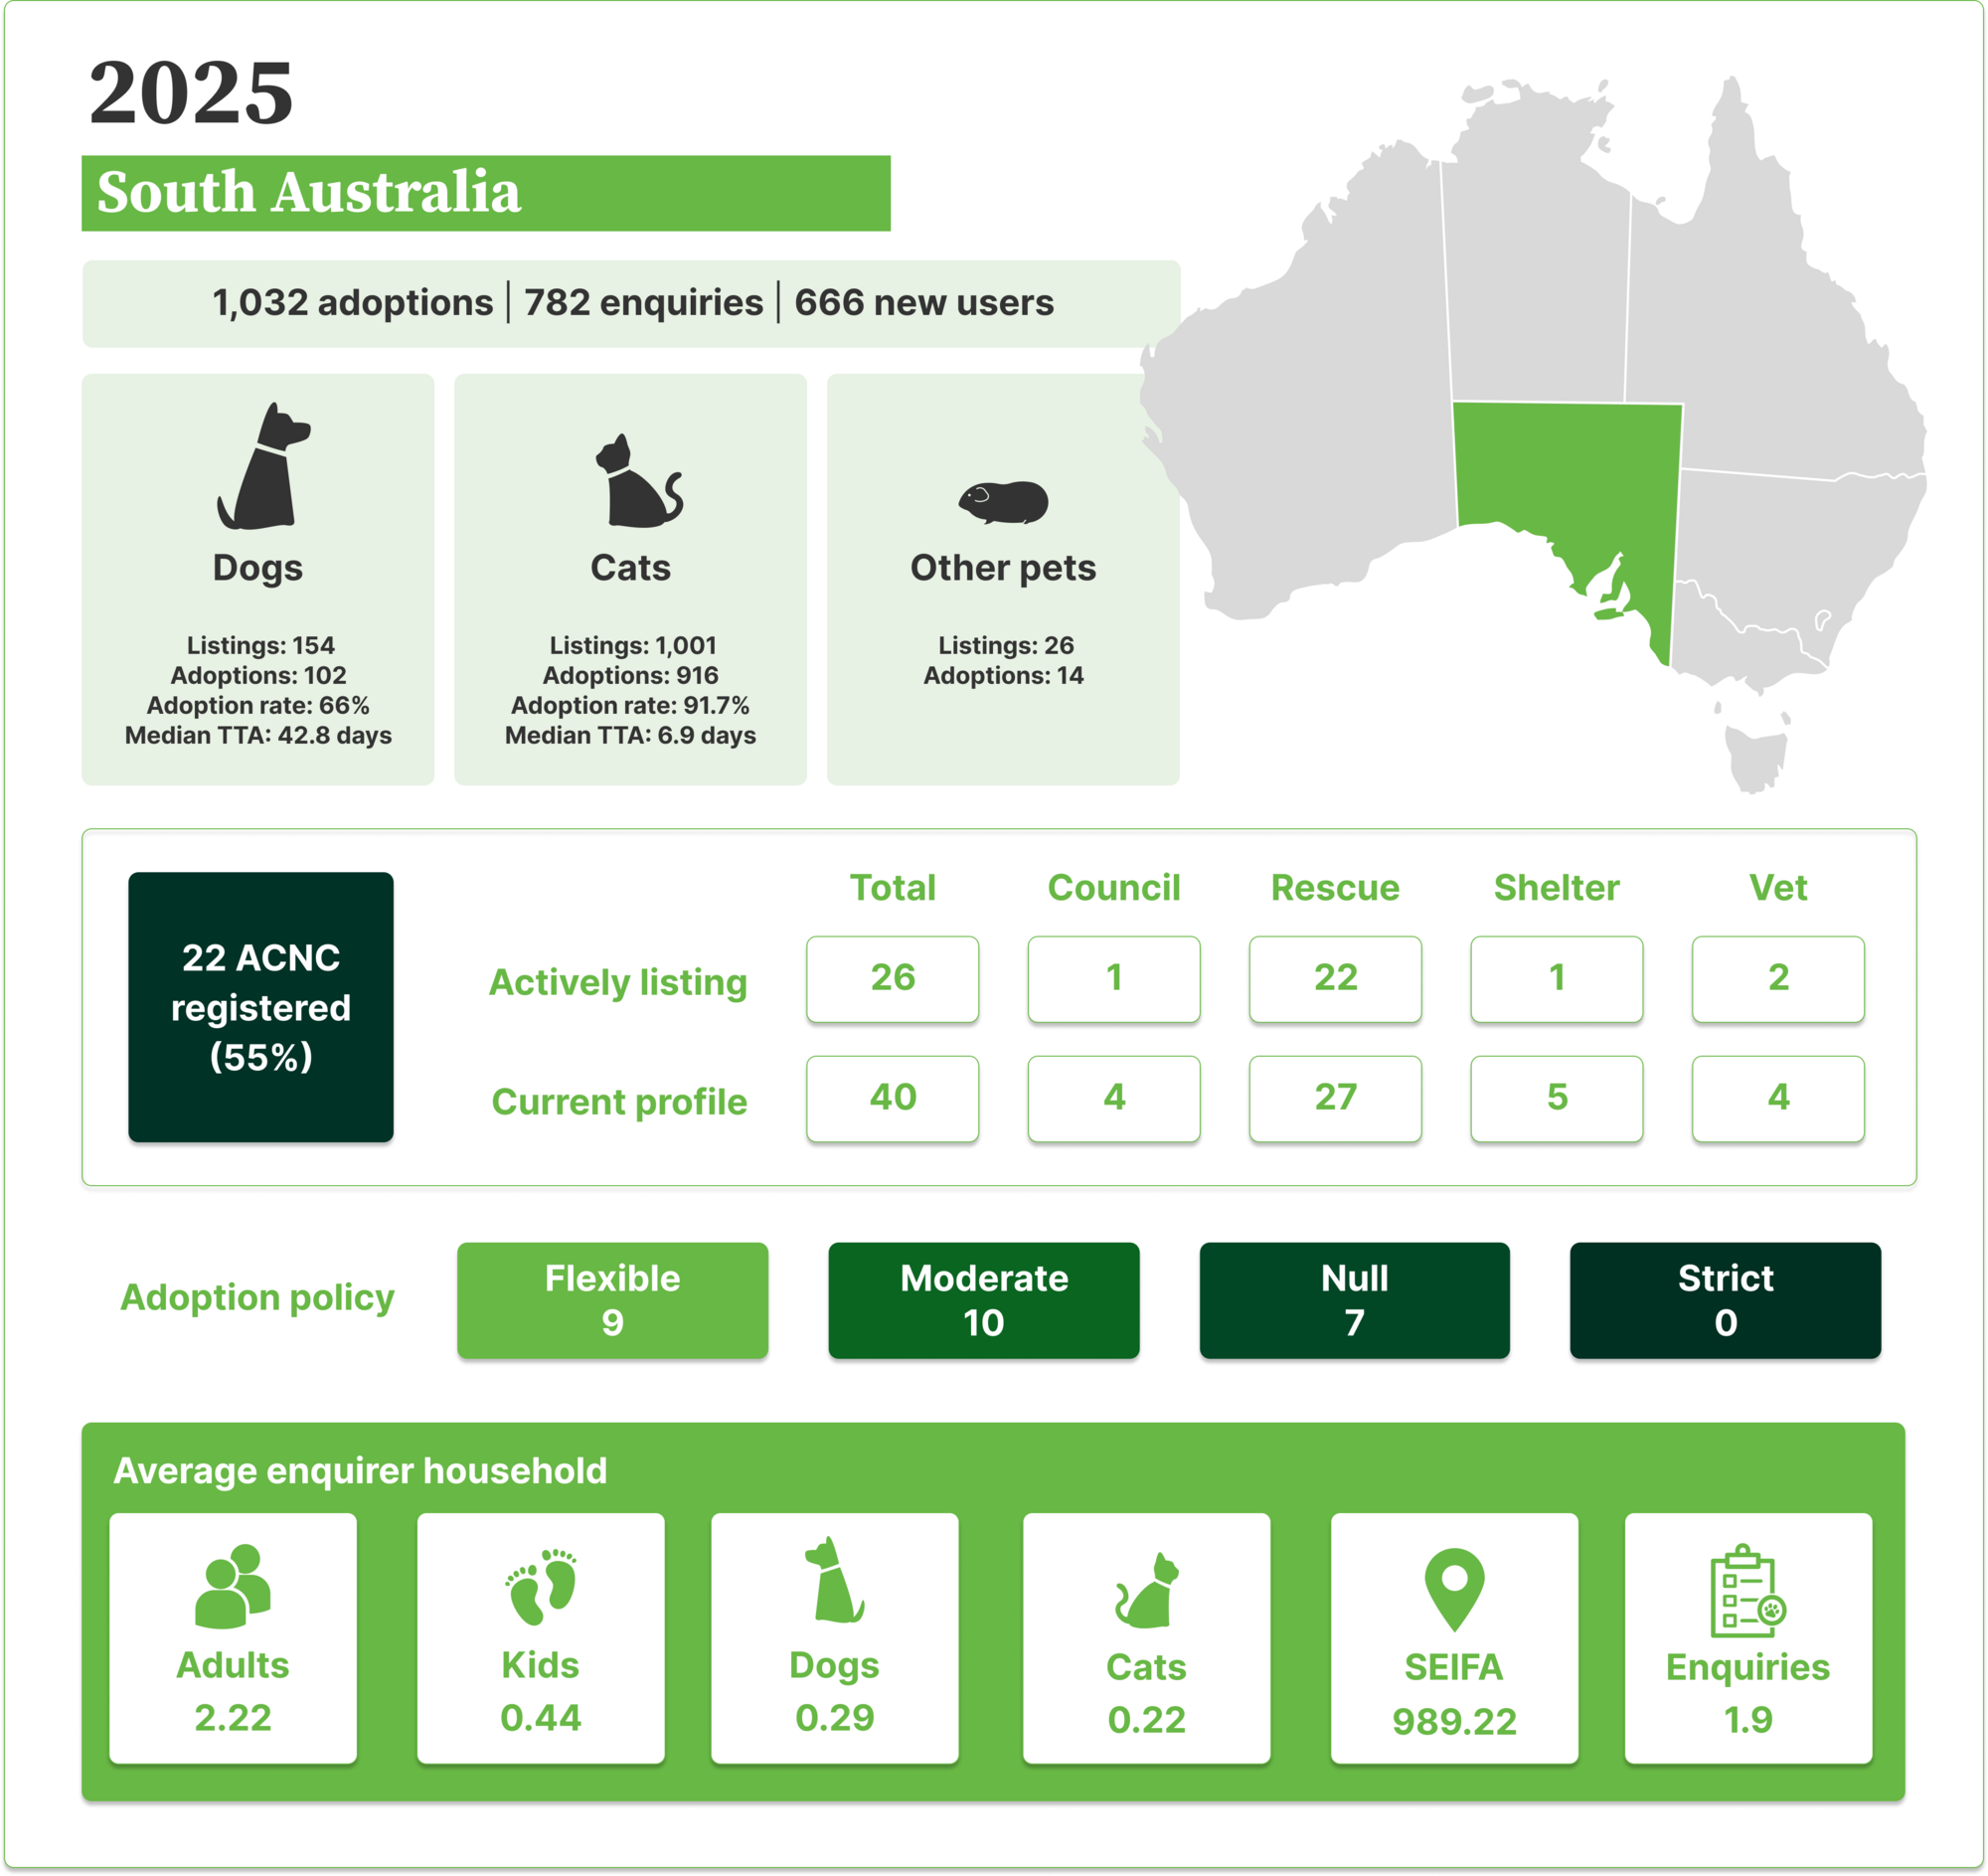
In 2025, 1,032 pets were adopted via PetRescue in SA, with 782 enquiries submitted and 666 new users created.
🐱 Cat listings: 1,001 | Adoptions: 916 | Adoption rate: 95% | Median TTA: 6.9 days
🐶 Dog listings: 154 | Adoptions: 102 | Adoption rate: 66% | Median TTA: 42.8 days
🐾 Other listings: 26 | Adoptions: 14
26 member organisations were actively listing pets in SA, made up of 1 council, 22 rescue groups, 1 shelter and 2 vet clinics. Of the 40 current SA member profiles, 22 are registered charities with the Australian Charities and Not-for-profits Commission (ACNC), representing 55% of SA membership.
Of the 26 actively listing members, adoption policy breakdown was as follows: 9 flexible, 10 moderate and 7 with no policy selected. No SA members currently operate with a strict adoption policy.
SA stands out for dogs in a concerning way: only a 66.2% adoption rate and 42.8-day median TTA, a stark contrast to SA's strong cat performance of 91.7%. This suggests SA's rescue community is heavily cat-focused with limited dog rehoming capacity.
SA's dog adoption rate of 66.2% and median TTA of 42.8 days is a stark contrast to its strong cat adoption rate of 91.7%.
From the overall dataset (2019-2025), 5,288 users were active in SA, of which 2,852 (54%) were repeat users. 459 user profiles submitted no enquiries.
The average SA enquirer household contained 2.2 adults, 0.44 kids, 0.29 dogs and 0.22 cats, with a SEIFA Score of 989.22, submitting an average of 1.9 enquiries.
Tasmania
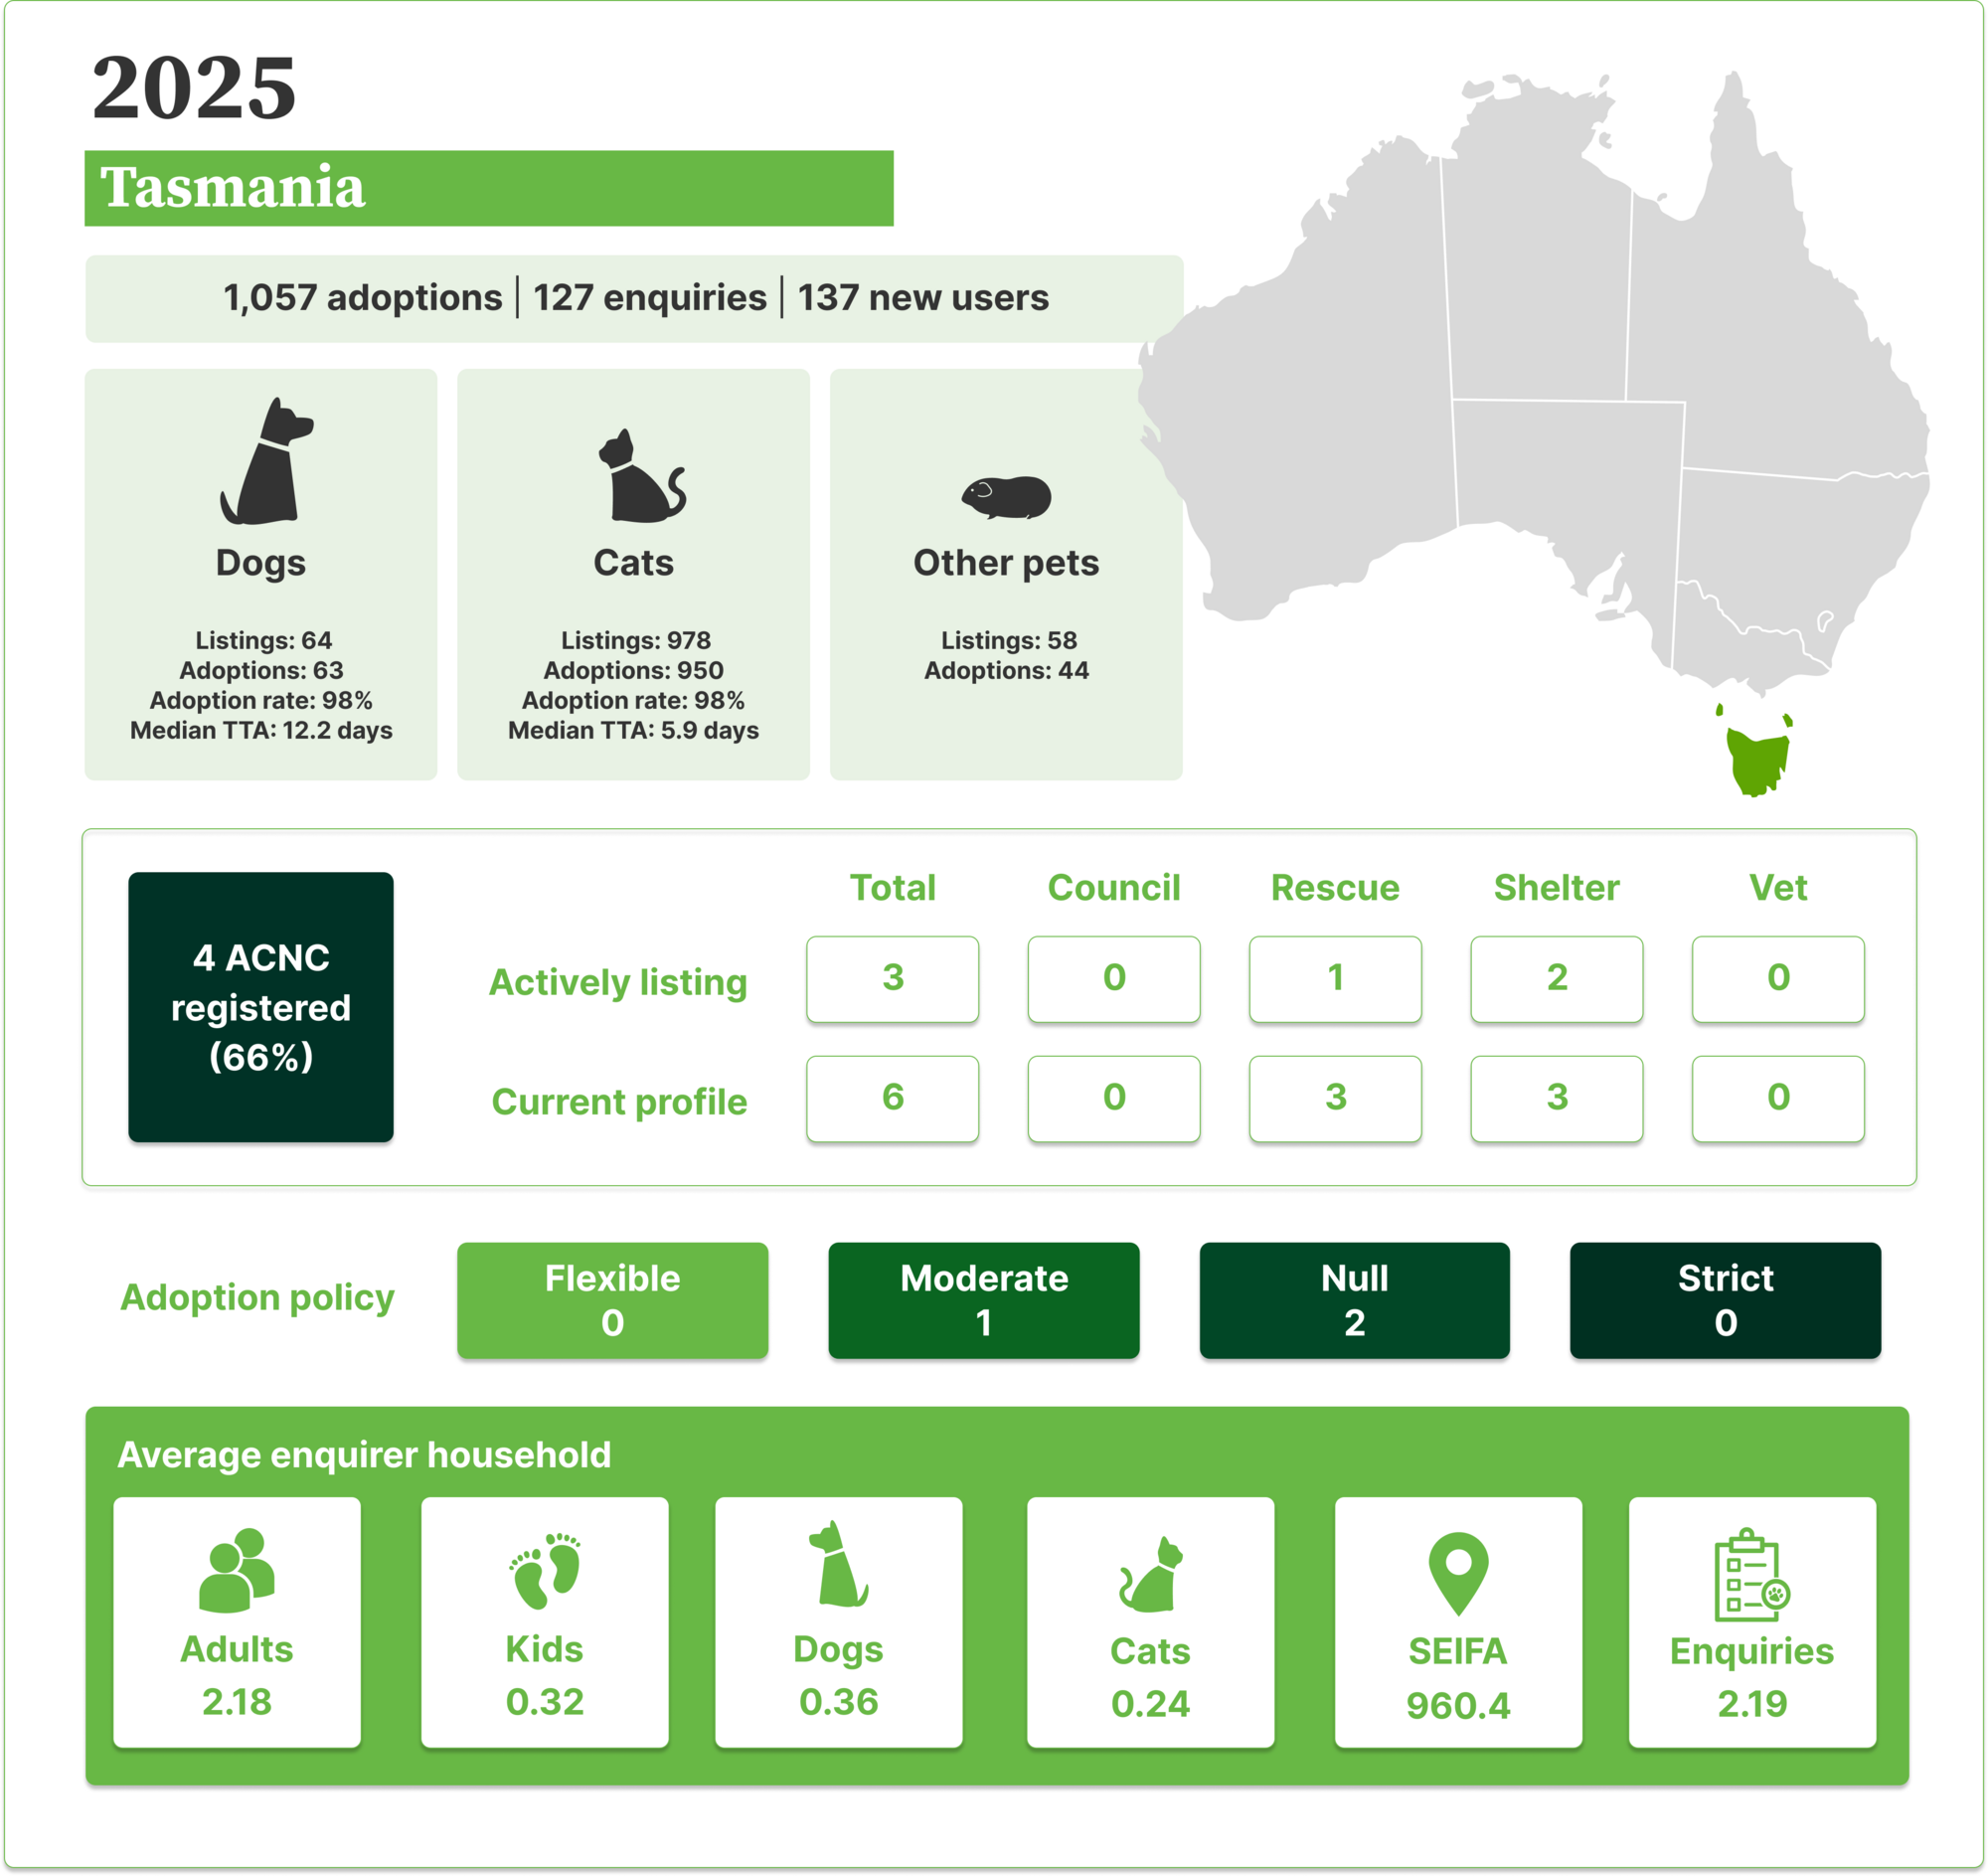
In 2025, 1,057 pets were adopted via PetRescue in Tasmania, with 127 enquiries submitted and 137 new users created.
🐱 Cat listings: 978 | Adoptions: 950 | Adoption rate: 98% | Median TTA: 5.9 days
🐶 Dog listings: 64 | Adoptions: 63 | Adoption rate: 98% | Median TTA: 12.2 days
🐾 Other listings: 58 | Adoptions: 44
3 member organisations were actively listing pets in Tasmania, made up of 1 rescue group and 2 shelters. Of the 6 current Tasmania member profiles, 4 are registered charities with the Australian Charities and Not-for-profits Commission (ACNC), representing 66% of Tasmania membership.
Of the 3 actively listing members, adoption policy breakdown was as follows: 1 moderate and 2 with no policy selected. No Tasmania members currently operate with a flexible or strict adoption policy.
From the overall dataset (2019-2025), 685 users were active in Tasmania, of which 301 (44%) were repeat users. 71 user profiles submitted no enquiries.
The average Tasmania enquirer household contained 2.18 adults, 0.32 kids, 0.36 dogs and 0.24 cats, with a SEIFA Score of 960.4, submitting an average of 2.19 enquiries.
Victoria
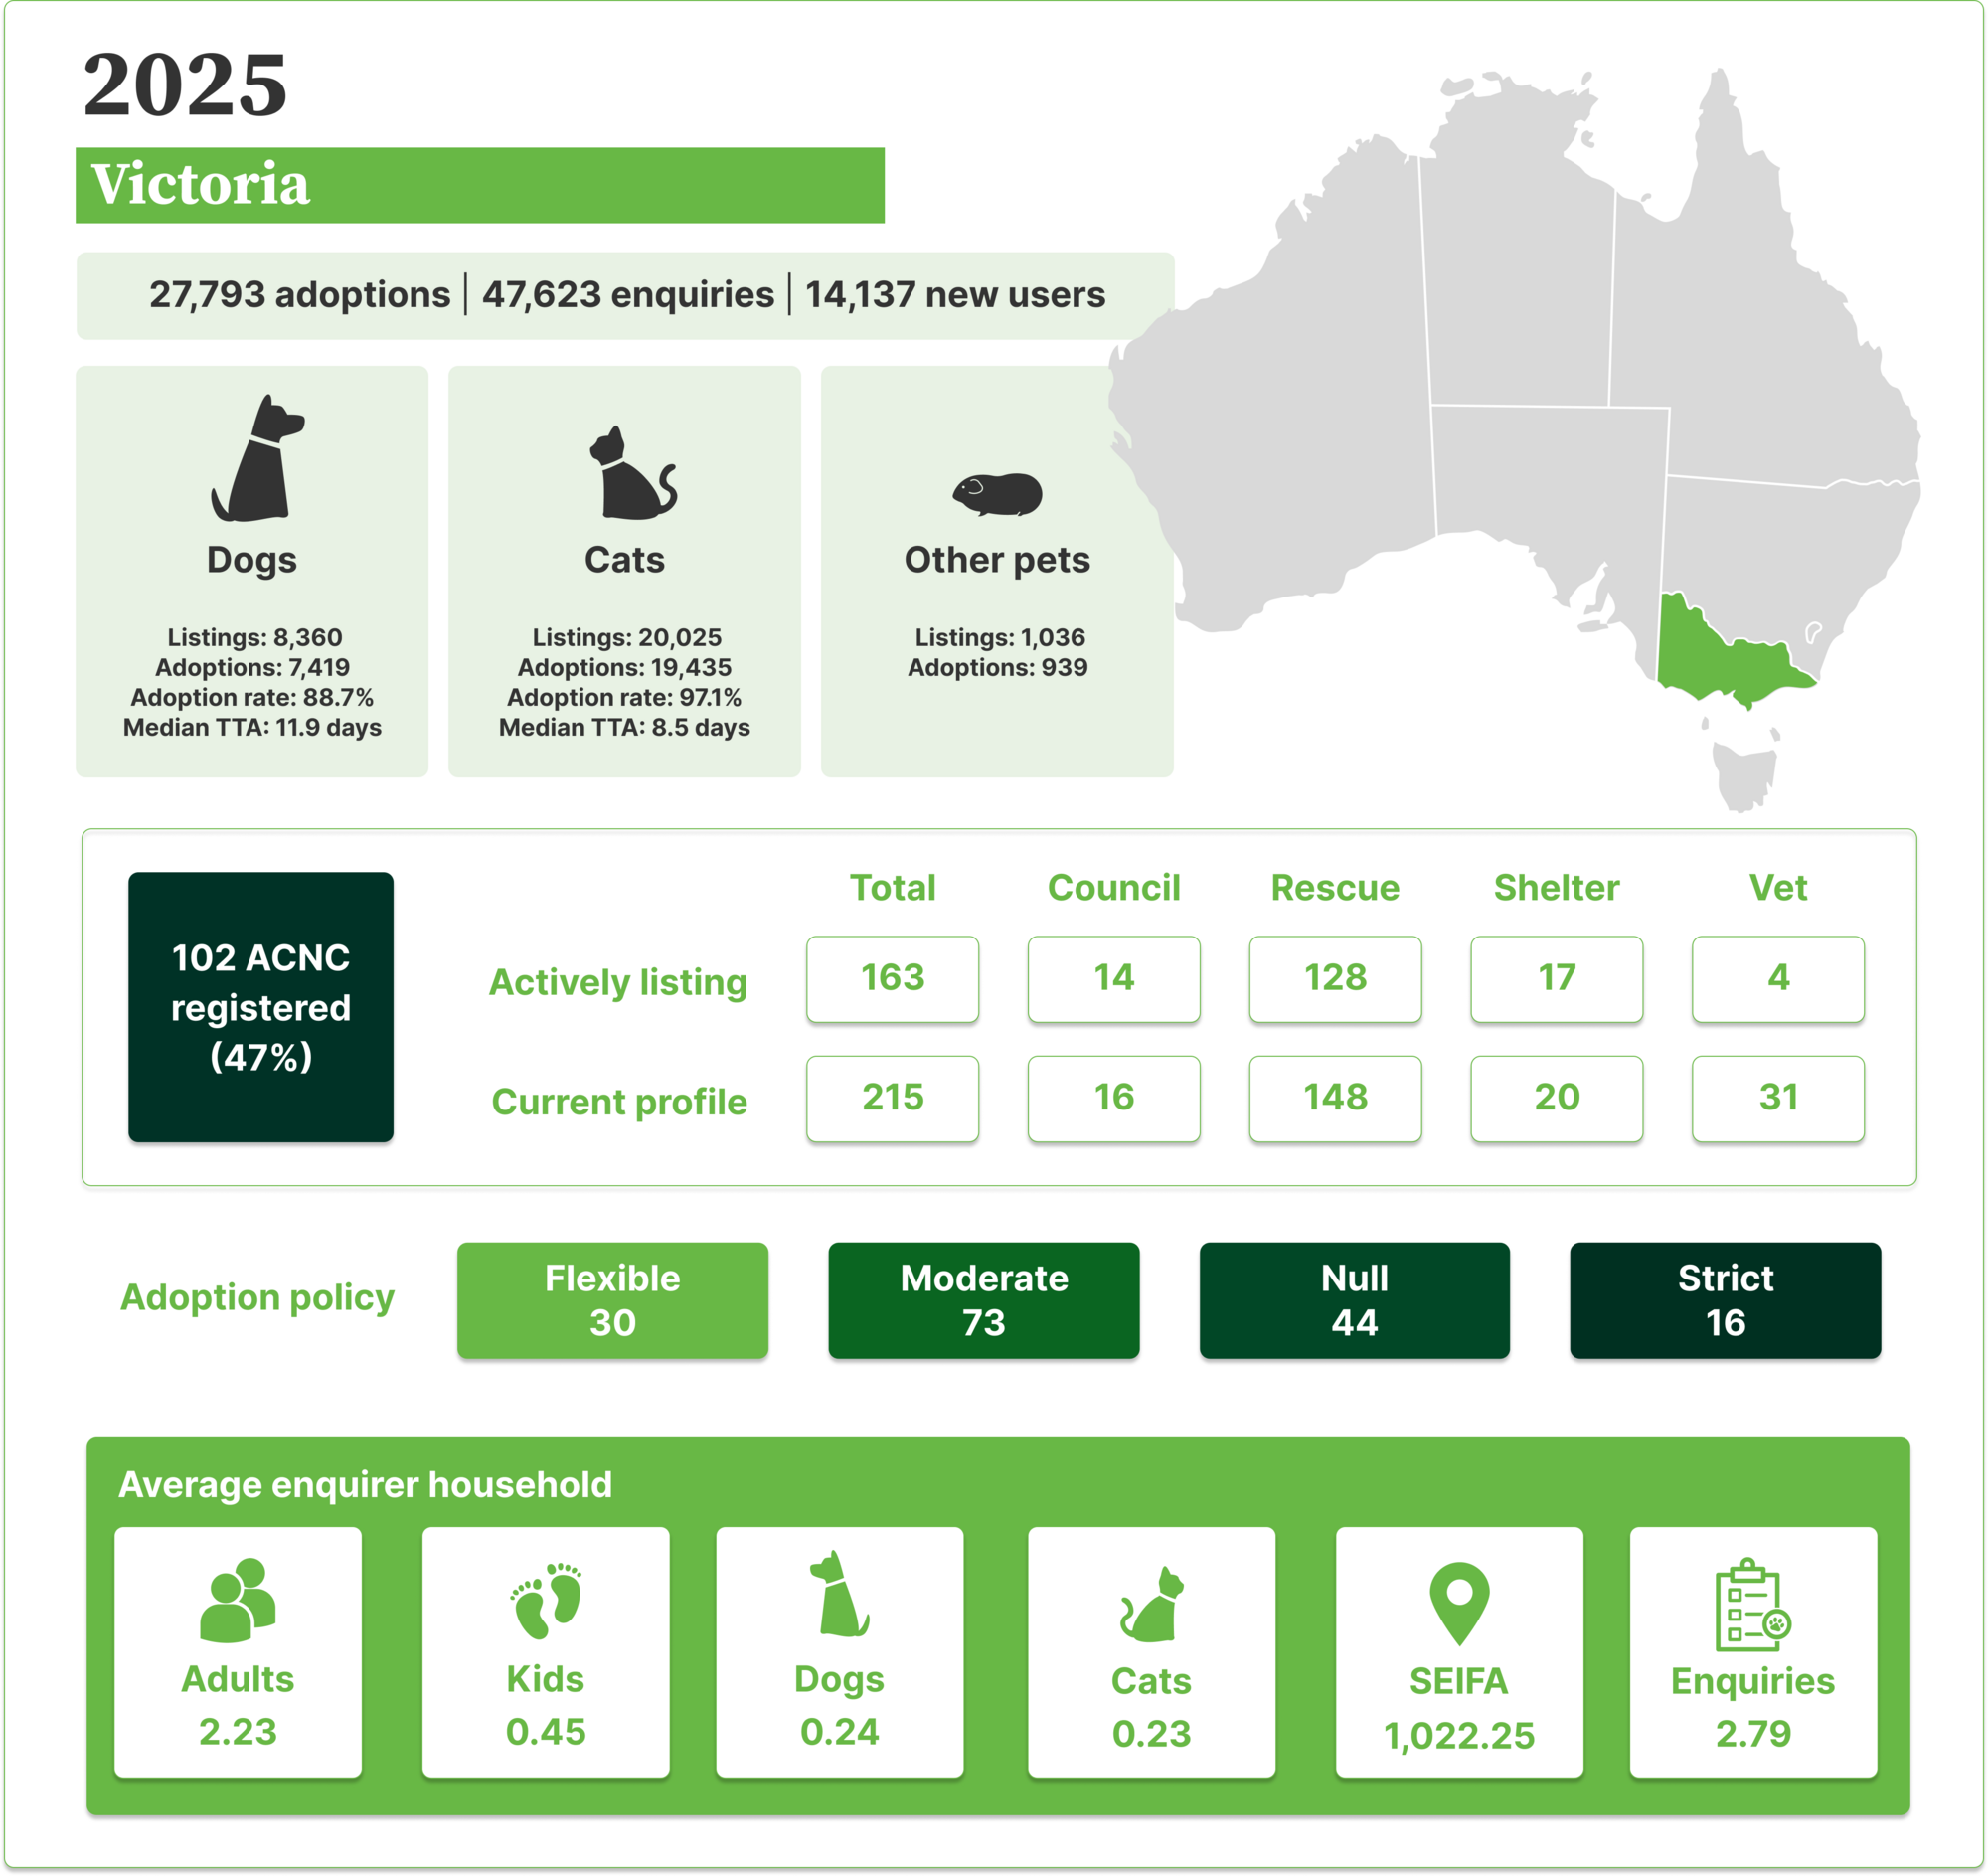
In 2025, 27,793 pets were adopted via PetRescue in Victoria, with 47,623 enquiries submitted and 14,137 new users created.
🐱 Cat listings: 20,025 | Adoptions: 19,435 | Adoption rate: 97.1% | Median TTA: 8.5 days
🐶 Dog listings: 8,360 | Adoptions: 7,419 | Adoption rate: 88.7% | Median TTA: 11.9 days
🐾 Other listings: 1,036 | Adoptions: 939
163 member organisations were actively listing pets in Victoria, made up of 14 councils, 128 rescue groups, 17 shelters and 4 vet clinics. Of the 215 current Victoria member profiles, 102 are registered charities with the Australian Charities and Not-for-profits Commission (ACNC), representing 47% of Victoria membership.
Of the 163 actively listing members, adoption policy breakdown was as follows: 30 flexible, 73 moderate, 44 with no policy selected and 16 strict.
From the overall dataset (2019-2025), 126,291 users were active in Victoria, of which 52,341 (41%) were repeat users. 7,008 user profiles submitted no enquiries.
The average Victoria enquirer household contained 2.23 adults, 0.45 kids, 0.24 dogs and 0.23 cats, with a SEIFA Score of 1,022.25, submitting an average of 2.79 enquiries.
Victoria generates roughly half of all platform enquiries nationally and is the largest state by both listing volume and adoptions. As previously noted, Victoria has seen significant and sustained growth in listings to an all-time high of 29,519 in 2025. Adoptions have tracked this growth closely, maintaining a 95-96% adoption rate through until 2025, when a modest drop to 91% was observed.
Victoria's high listing and adoption rates are largely sustained by cats and kittens, and as discussed in previous State of Pet Adoption Reports, the introduction of mandatory reporting of animal outcomes in the state drove substantial growth in these numbers. Pet listing removals have slowly surpassed pre-pandemic levels, reaching a high of 899 in 2025.
Importantly, while a small reduction in adoption rate in 2025 was observed, the whole of year, all species adoption metrics hide the true extent of falling adoption rates that are seen more clearly in NSW data. This is because cat and kitten adoptions remain strong in Victoria (although not keeping pace with increases in listings) and the onset of the falling adoption rate occurred later in Victoria than in NSW.
At the end of December 2025, both dog (55%) and cat (72%) monthly adoption rates were steadily declining in Victoria, suggesting the 2026 full-year data will more clearly reflect current trends.
As the most urbanised of the big three eastern states, it is perhaps a little surprising that PetRescue membership in Victoria is consistent with national trends, with 65% of members located in metro areas. At 78%, Victorian account holders are highly skewed towards metro areas. As cat ownership is more centred in metropolitan households, this could explain the strong sustained adoption demand for cats and kittens despite increasingly high listings.
Of perhaps largest concern for Victoria is that despite cat adoptions being the highest recorded by PetRescue, the adoption rate for cats is continuing to fall, driven by the increasing number of listings. In Victoria specifically, it appears that cat and kitten adoption demand has reached a ceiling and the system simply does not have the capacity to absorb further available cats. Given slow adoption rates in NSW and restrictions on movement of cats into Tasmania, it is unlikely that transport of pets to areas with fewer available cats is likely to play a large role in alleviating this pressure. Further changes to domestic cat management in Victoria will be required to reduce breeding in community cat populations and drive down intake into the system, alleviating capacity pressure on adoption organisations.
Western Australia
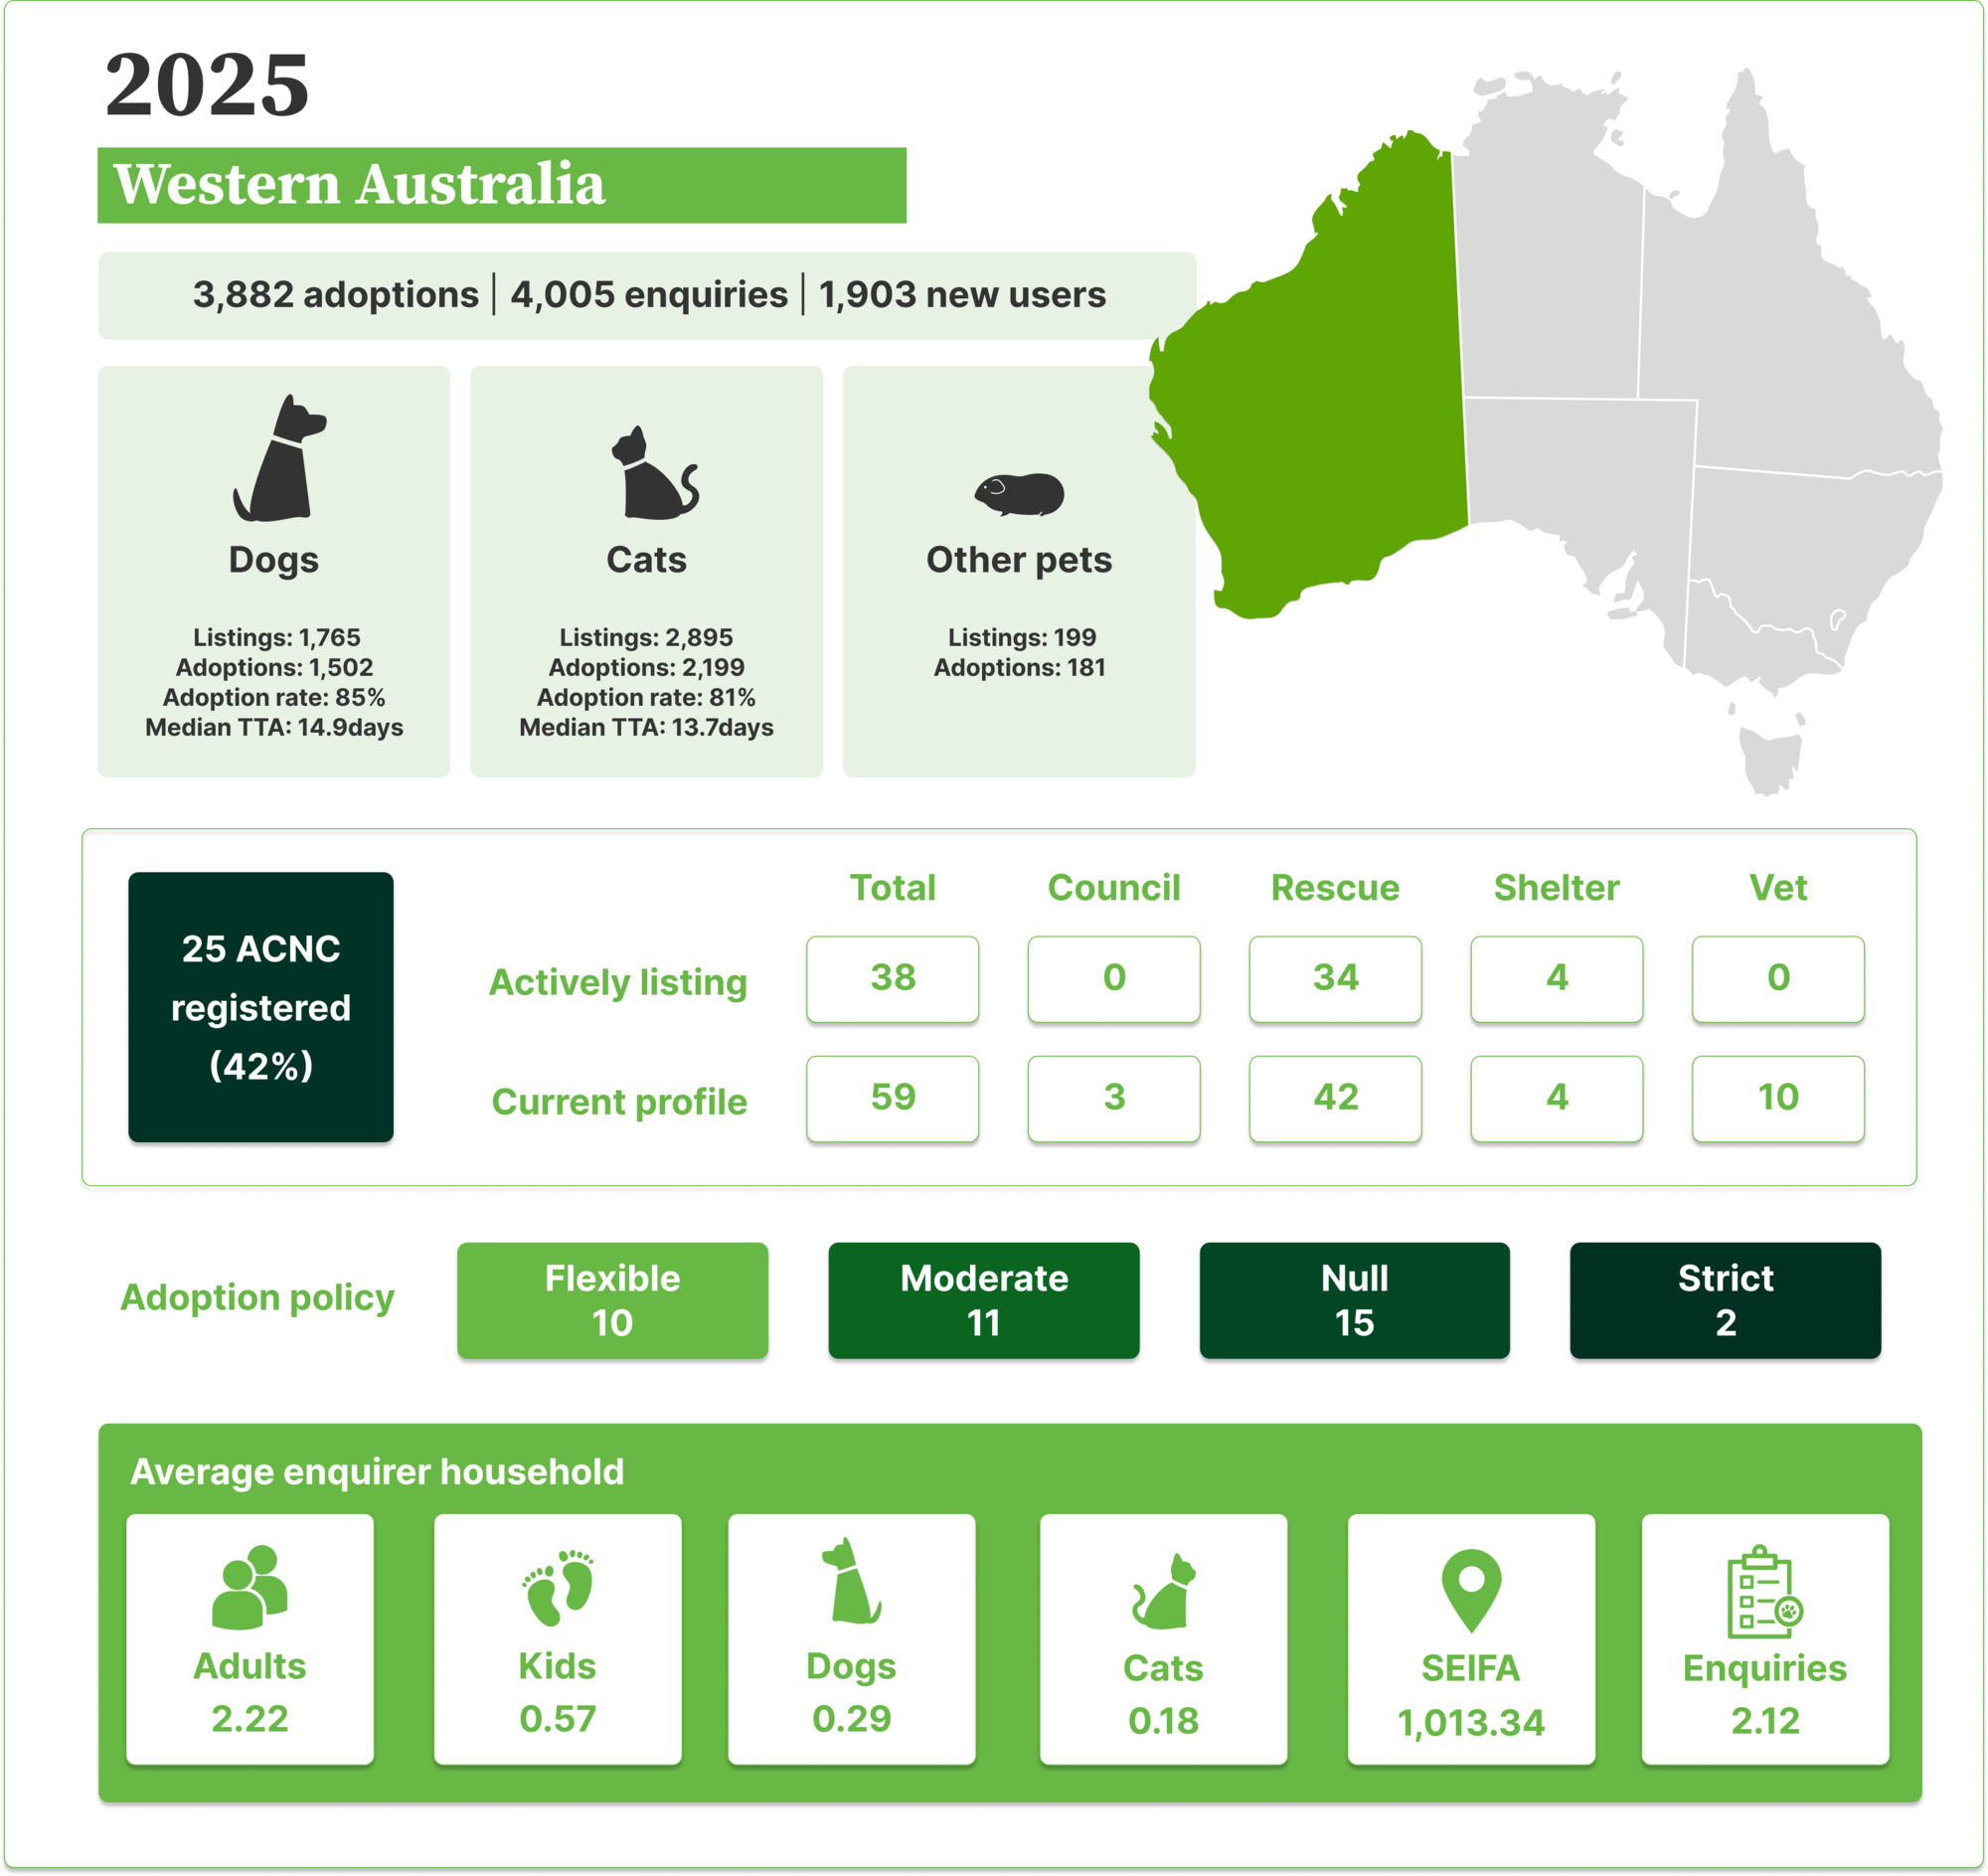
In 2025, 3,882 pets were adopted via PetRescue in Western Australia, with 4,005 enquiries submitted and 1,903 new users created.
🐱 Cat listings: 2,895 | Adoptions: 2,199 | Adoption rate: 81% | Median TTA: 13.7 days
🐶 Dog listings: 1,765 | Adoptions: 1,502 | Adoption rate: 85% | Median TTA: 14.9 days
🐾 Other listings: 199 | Adoptions: 181
38 member organisations were actively listing pets in Western Australia, made up of 0 council, 34 rescue groups, 4 shelters and 0 vet clinic. Of the 59 current Western Australia member profiles, 25 are registered charities with the Australian Charities and Not-for-profits Commission (ACNC), representing 42% of Western Australia membership.
Of the 38 actively listing members, adoption policy breakdown was as follows: 10 flexible, 11 moderate, 15 with no policy selected and 2 strict.
From the overall dataset (2019-2025), 20,042 users were active in Western Australia, of which 9,818 (49%) were repeat users. 1,293 user profiles submitted no enquiries.
The average Western Australia enquirer household contained 2.22 adults, 0.57 kids, 0.29 dogs and 0.18 cats, with a SEIFA score of 1,013.34, submitting an average of 2.12 enquiries.
Adoption activity in Western Australia is extremely urban-centric, with both member location and account holder locations highly skewed towards Greater Perth.

Jump to specific insights from the report:
Images: Canva, unless captioned otherwise.