


A section with key insights from State of Pet Adoption Platform Insights 2025
General characteristics of PetRescue.com.au enquirers

Who are the potential and prospective pet adopters?
PetRescue.com.au enquirers represent a diverse group of potential and prospective pet adopters, with household composition, existing pets, and family circumstances helping to shape how they search for and adopt pets.
Household demographics of PetRescue.com.au enquirers in 2025
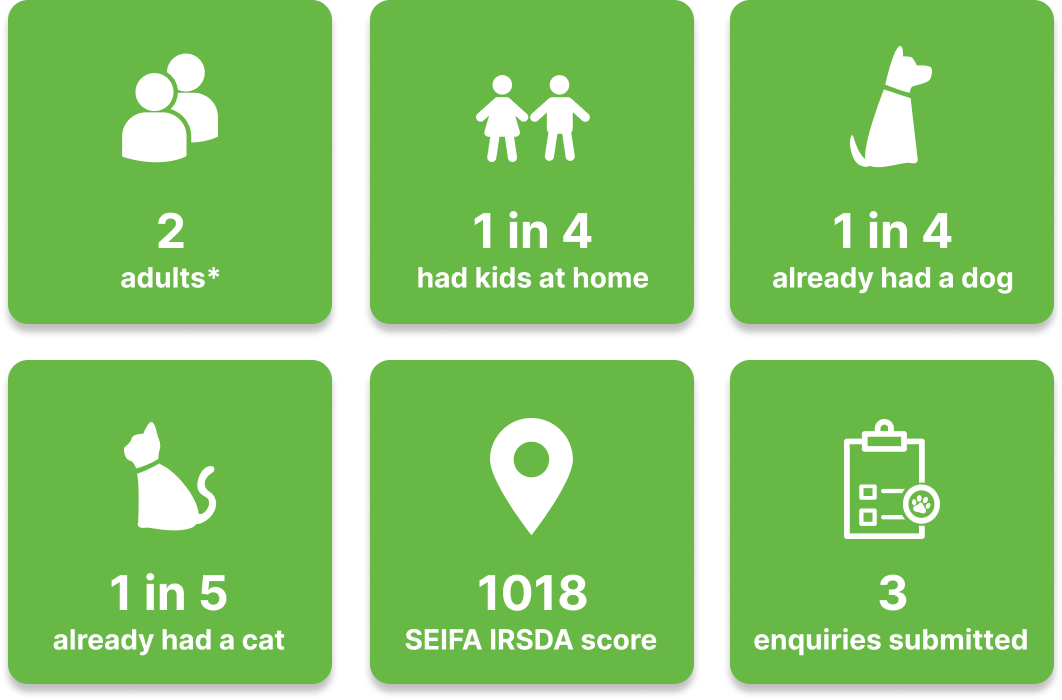
*66% were 2 adult households
In 2025, the typical PetRescue enquirer household contained:
- 2.29 adults (with 66% living with one other adult)
- 0.6 kids (around 1 in 4 households had at least one child at home)
- 0.34 dogs and 0.29 cats (around 1 in 4 households already had a dog and 1 in 5 already had a cat).
- Households were located in a mid-to-higher socioeconomic suburb (SEIFA IRSAD Score of 1018) and submitted an average of 3 enquiries.
- Most enquirers were couples without children or existing pets, and few households had more than 2 existing dogs or cats.
In 2025, 1 in 5 enquirers were return users. Users with more kids or pets in the home were slightly more likely to be repeat users and tended to submit slightly more enquiries overall. This likely indicates that those with stricter requirements around the pet they are hoping to adopt are more willing to persist in finding the right fit, and also slightly more likely to come back to PetRescue to adopt again after a successful match.
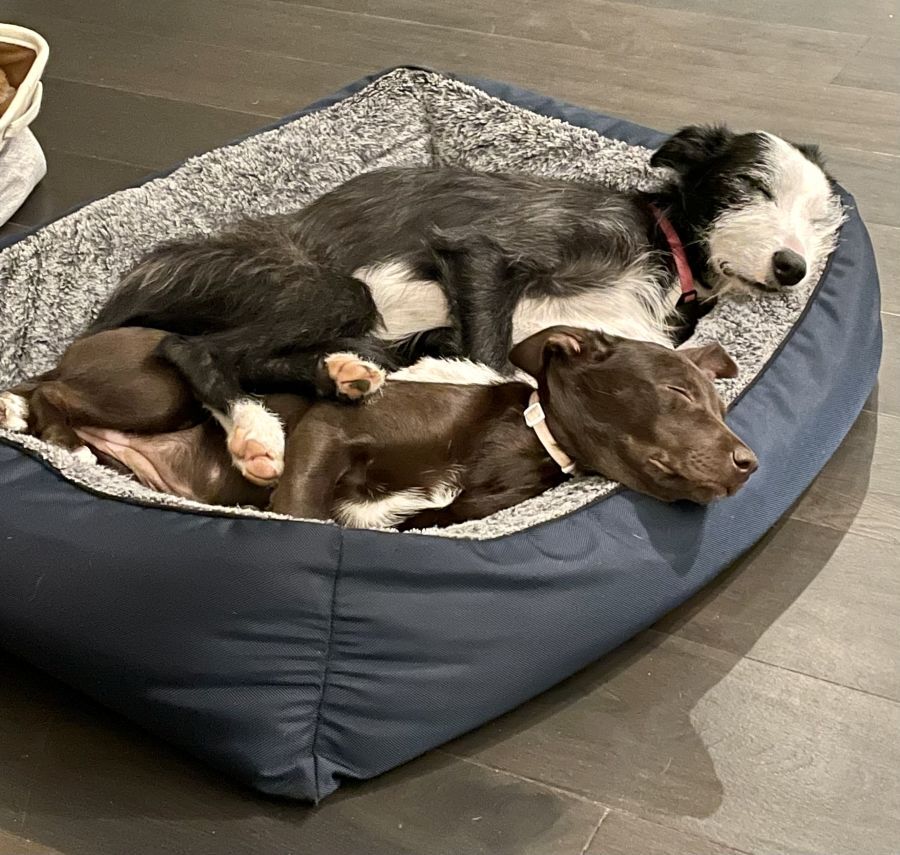
Read about Bffs Tilly and Teddy's happy ending
Trends in PetRescue.com.au enquirer characteristics over time
By 2025, nearly 1 in 4 dog adopters already had a dog at home (average 0.24 dogs per household), up from around 1 in 7 (0.15) in 2020. Cat adopters told a similar story, rising from about 1 in 5 (0.19) to roughly 1 in 4 (0.26) over the same period. This suggests a shift towards multi-pet households seeking additional pets rather than first-time pet owners. Households with children in the home has risen modestly for all species, with other pet enquirers having the highest average (0.45), suggesting families with children are disproportionately drawn to rabbits, guinea pigs, etc.
The proportion of annual platform users that are repeat enquirers has dropped by more than 50% since 2021, down from 52% to 1 in 5 enquirers in 2025. The largest drop coincides with the introduction of the enquiry wall to increase the quality of enquiries, after which the proportion of repeat users has stabilised. This may simply be an artefact of greater visibility of new users due to the requirement for them to create profiles.
Alternatively, as repeat engagement is often linked to households returning to adopt another pet after a previous one passes away, if current enquirers are already managing multiple pets in a high-cost environment, they may be less likely to return to the platform as frequently to add more pets to their home.
The proportion of users from SEIFA IRSAD Deciles 8-10 (highest) has remained steady at just over 40% for at least 6 years, apart from a high during the pandemic when it rose to 45%. SEIFA IRSAD (Socio-Economic Indexes for Areas: Index of Relative Socio-economic Advantage and Disadvantage) is an Australian Bureau of Statistics measure that ranks geographic areas from most disadvantaged to most advantaged, drawing on Census data including household income, education, employment and housing. Deciles 8 to 10 represent the top 30% of areas nationally by this measure, meaning a significant and disproportionate share of enquirers come from higher income, more advantaged households. This aligns with findings explored further in PetRescue's Home2Home insights report.

Jump to specific insights from the report:
Images: Canva, unless captioned otherwise.