


The data presented below is from PetRescue.com.au and spans from 1 January 2022 to 30 June 2026. Figures reflect listings and adoptions made through the PetRescue platform by member organisations. They are not a full census of animal welfare activity in New South Wales and do not include animals rehomed outside the platform.
General caveats (apply to all charts)
-
Figures include cats and dogs only; other species are excluded.
-
State is based on the state recorded on the listing, not the state in which the listing organisation is located. Some pets may have been in the care of an organisation based in another state, but located with a foster carer in NSW
-
Quarterly figures may be revised in future extracts if underlying records are updated or corrected after the fact.
-
"Other" includes vet-listed pets, owner-to-owner (Home2Home) listings, and any group with no recorded organisation type. Where this category appears negligible in the chart, it may still represent a meaningful number of records at certain points; refer to the underlying data file for exact values.
-
Because pound transfer and shelter transfer both involve movement of an animal from one organisation to another, an individual cat could in principle appear as an intake event for more than one organisation type across its journey (for example, transferred from a pound to a rescue group). Each listing is counted once, at the point it was listed, so this does not create double-counting within this chart, but it means the two panels are not independent populations of animals.
-
Two structural changes are visible in the New South Wales data that are not present, or are far less pronounced, in the Victoria data: a step increase in kitten listing and adoption volumes from 2025 onward (Chart 1 and Chart 2), and a substantial improvement in cat intake source recording completeness from 2024 onward (Chart 4 and Chart 5). Both warrant confirmation against underlying data or with relevant organisations before being described as changes in animal welfare outcomes, since both are also consistent with changes in data collection or reporting practice.
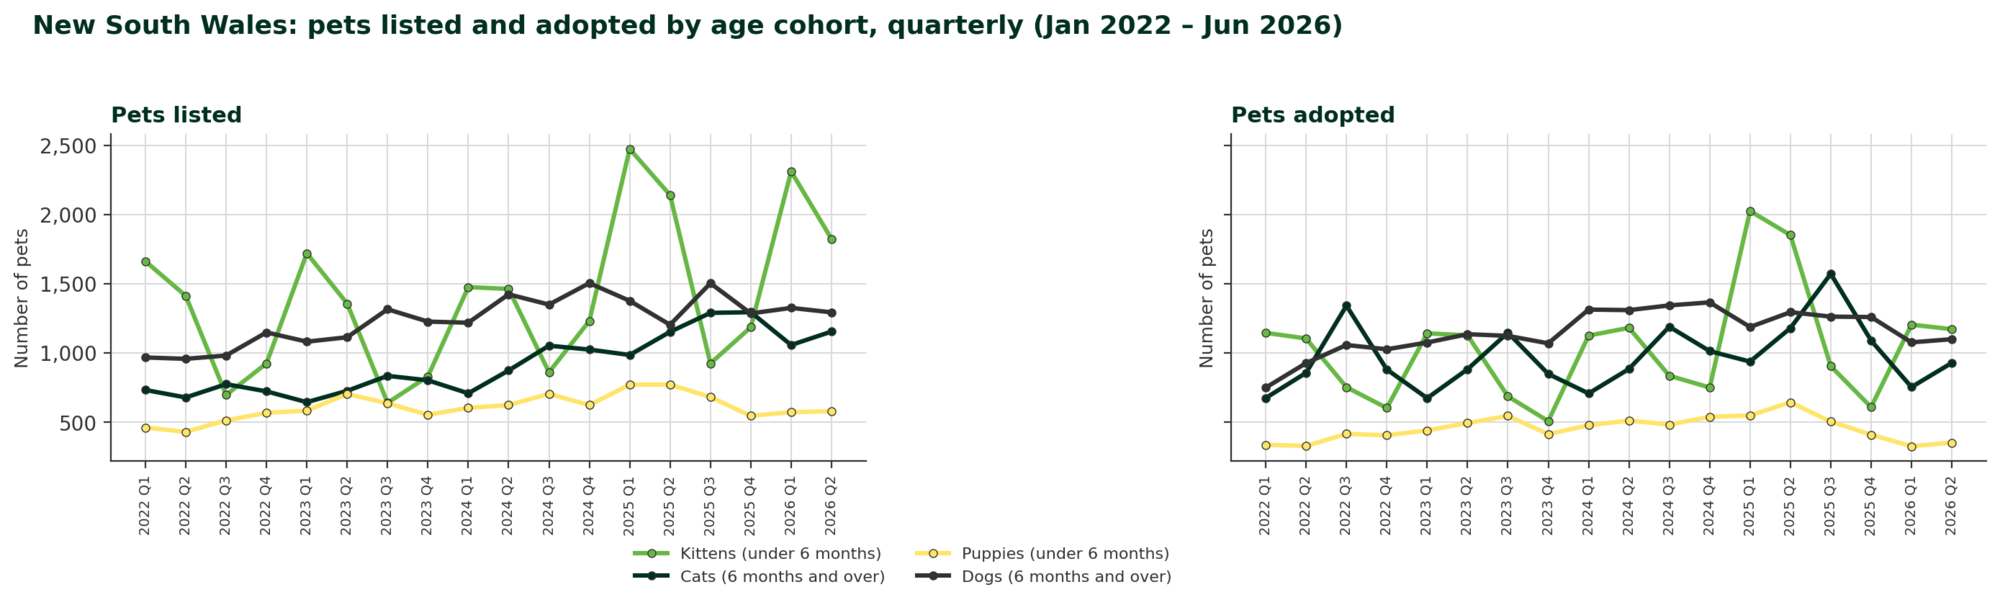
Chart 1: Pets listed and adopted by age cohort, quarterly
This chart shows quarterly volumes of cats, kittens, dogs and puppies listed and adopted via PetRescue in New South Wales, split into four cohorts: kittens and puppies (under 6 months) and cats and dogs (6 months and over).
Key patterns
-
Kitten listings and adoptions show the same underlying seasonal pattern seen in other states, peaking in Q1 to Q2 each year and falling to their lowest point in Q3.
-
Unlike the steady year-on-year increase seen in Victoria's Q1 kitten peak, New South Wales shows a step change from 2025 onward. Kitten listing peaks in Q1 2022 to Q1 2024 were generally in the 1,400 to 1,700 range, then rose sharply to around 2,480 in Q1 2025 and around 2,300 in Q1 2026.
-
Cat (6 months and over) listings show a steady upward trend across the period, from around 730 per quarter in early 2022 to around 1,100 to 1,150 by mid-2026, with comparatively little seasonal variation.
-
Dog listings have trended gently upward over the period, generally moving from around 950 to 1,000 per quarter in 2022 to around 1,300 to 1,500 in 2025 and 2026.
-
Puppy volumes are comparatively small throughout, rising gradually from around 450 to a plateau in the 550 to 700 range from 2023 onward.
-
Adoption volumes closely track listing volumes across all four cohorts, including the 2025 step change in kitten volumes.
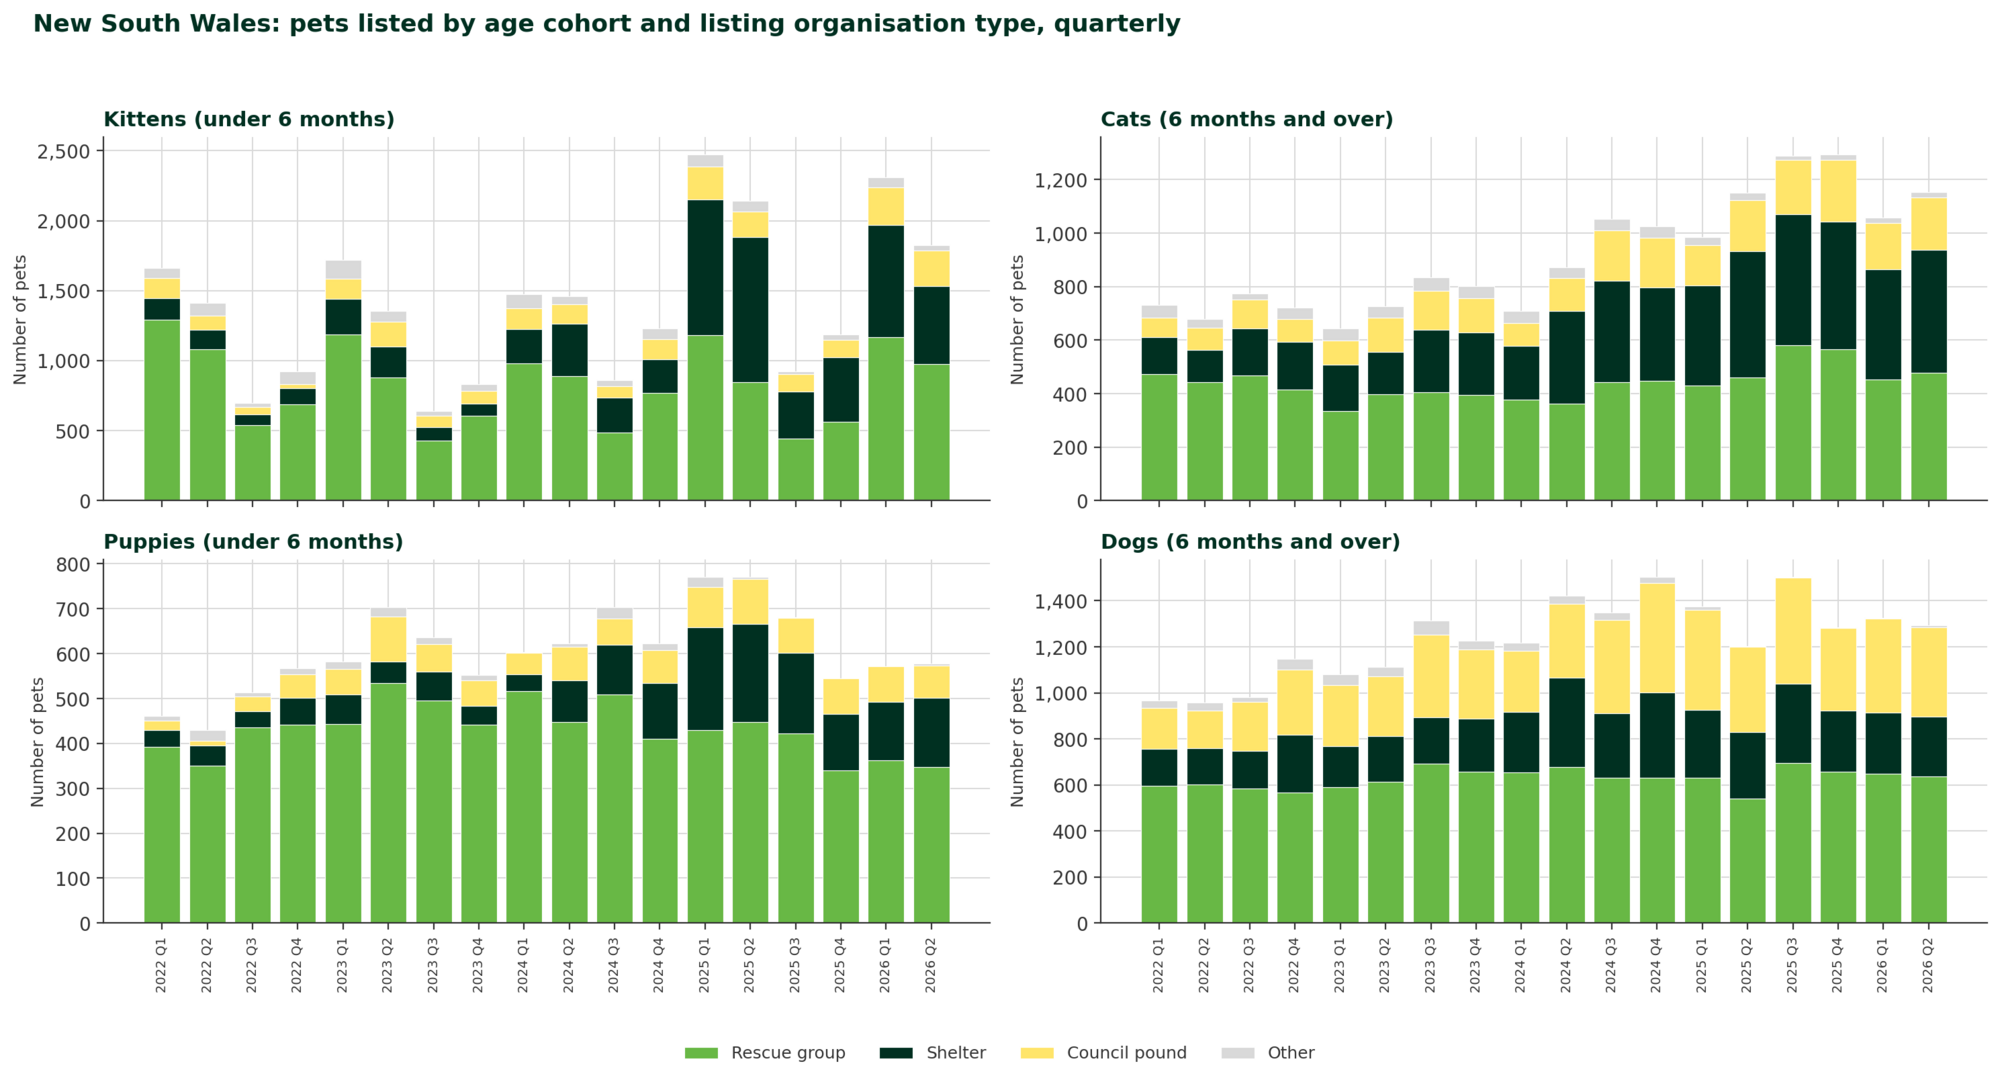
Chart 2: Pets listed by age cohort and listing organisation type, quarterly
This chart breaks down listing volumes for each of the four cohorts by the type of organisation that published the listing: rescue group, shelter, council pound, or other.
Key patterns
-
Rescue groups account for the largest single share of listings across all four cohorts in most quarters.
-
The 2025 to 2026 rise in kitten listings identified in Chart 1 is driven by a combination of rescue group and shelter listings, with shelter listings in particular making up a notably larger share of total kitten listings in Q1 2025, Q2 2025 and Q1 2026 than in prior quarters.
-
For cats and dogs (6 months and over), council pound's share has grown gradually over the period, becoming more visible in the breakdown from around 2024 onward.
-
For dogs specifically, council pound listings make up a consistently larger share than seen in the cat, kitten or puppy breakdowns, alongside rescue group and shelter.
Caveat
Given the shelter-driven kitten increase noted above, any communication referencing this trend should specify that it is a shelter and rescue group listing increase, not a change affecting all organisation types equally.
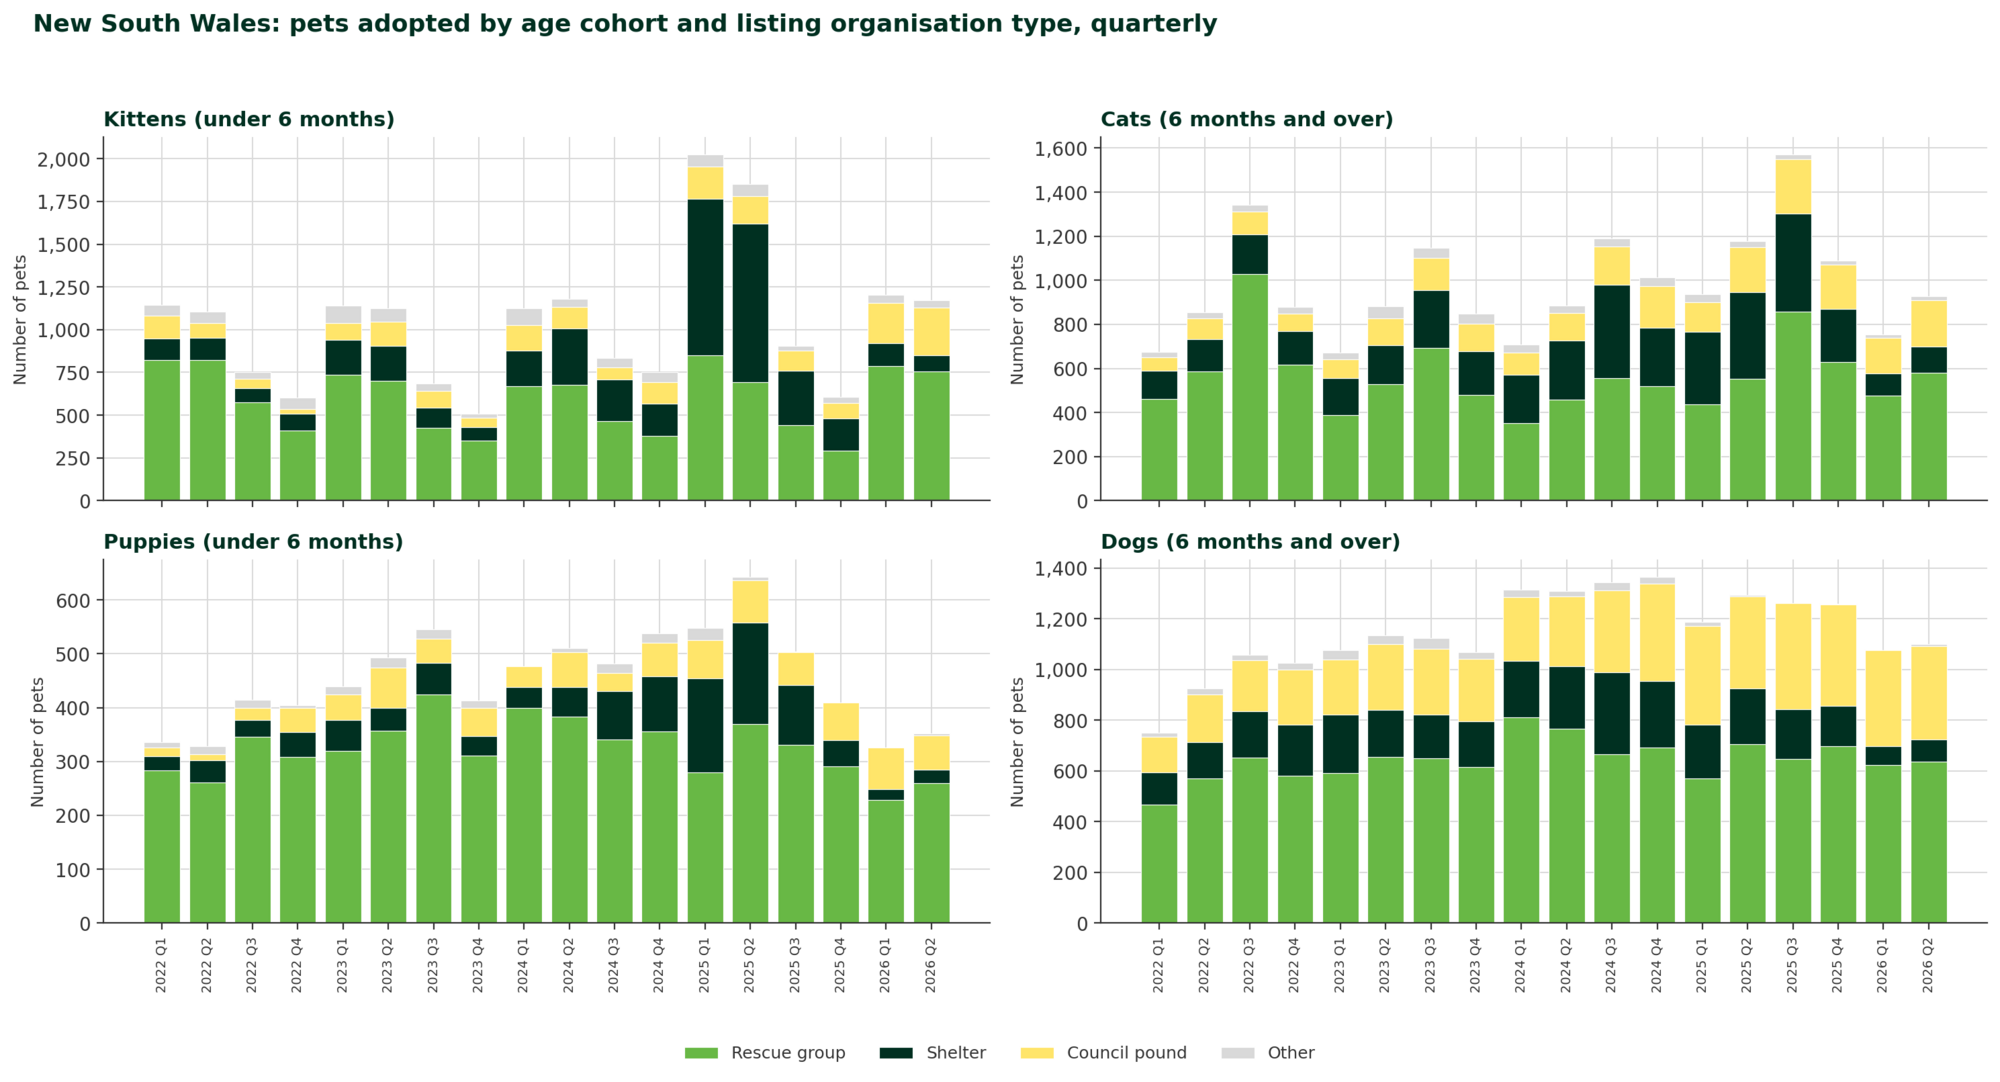
Chart 3: Pets adopted by age cohort and listing organisation type, quarterly
This chart shows the same organisation-type breakdown as Chart 2, applied to adoption volumes rather than listing volumes.
Key patterns
-
The relative proportions of rescue group, shelter and council pound adoptions broadly mirror the proportions seen in listings (Chart 2) for each cohort.
-
The increased shelter share of kitten listings from 2025 onward is also visible in adoptions over the same period, consistent with those listings converting to adoptions rather than remaining unadopted.
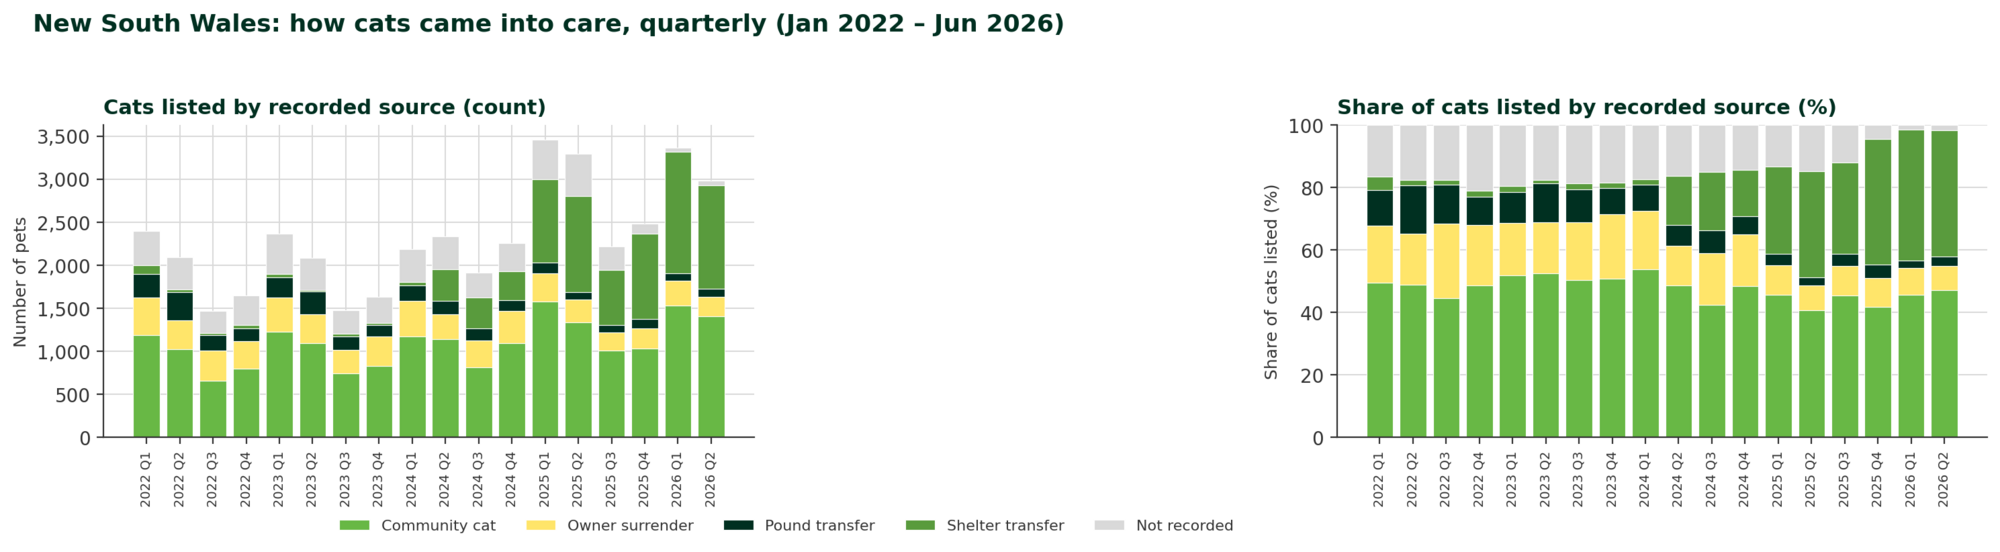
Chart 4: How cats came into care, quarterly
This chart shows quarterly cat listing volumes by recorded intake source (community cat, owner surrender, pound transfer, or shelter transfer), both as counts and as a percentage share.
Key patterns
-
Community cat has been the largest single recorded source of cats listed on the platform in New South Wales throughout the period, generally accounting for around 45 to 55 percent of listings with a recorded source.
-
Shelter transfer has grown substantially as a recorded source. It was a minor category through 2022 and 2023, then grew to become a significant share of listings from around Q2 2024 onward.
-
The "not recorded" share was substantial in 2022 and 2023, in the order of 15 to 20 percent of listings in some quarters, and has declined sharply since, falling to close to zero by late 2025 and into 2026.
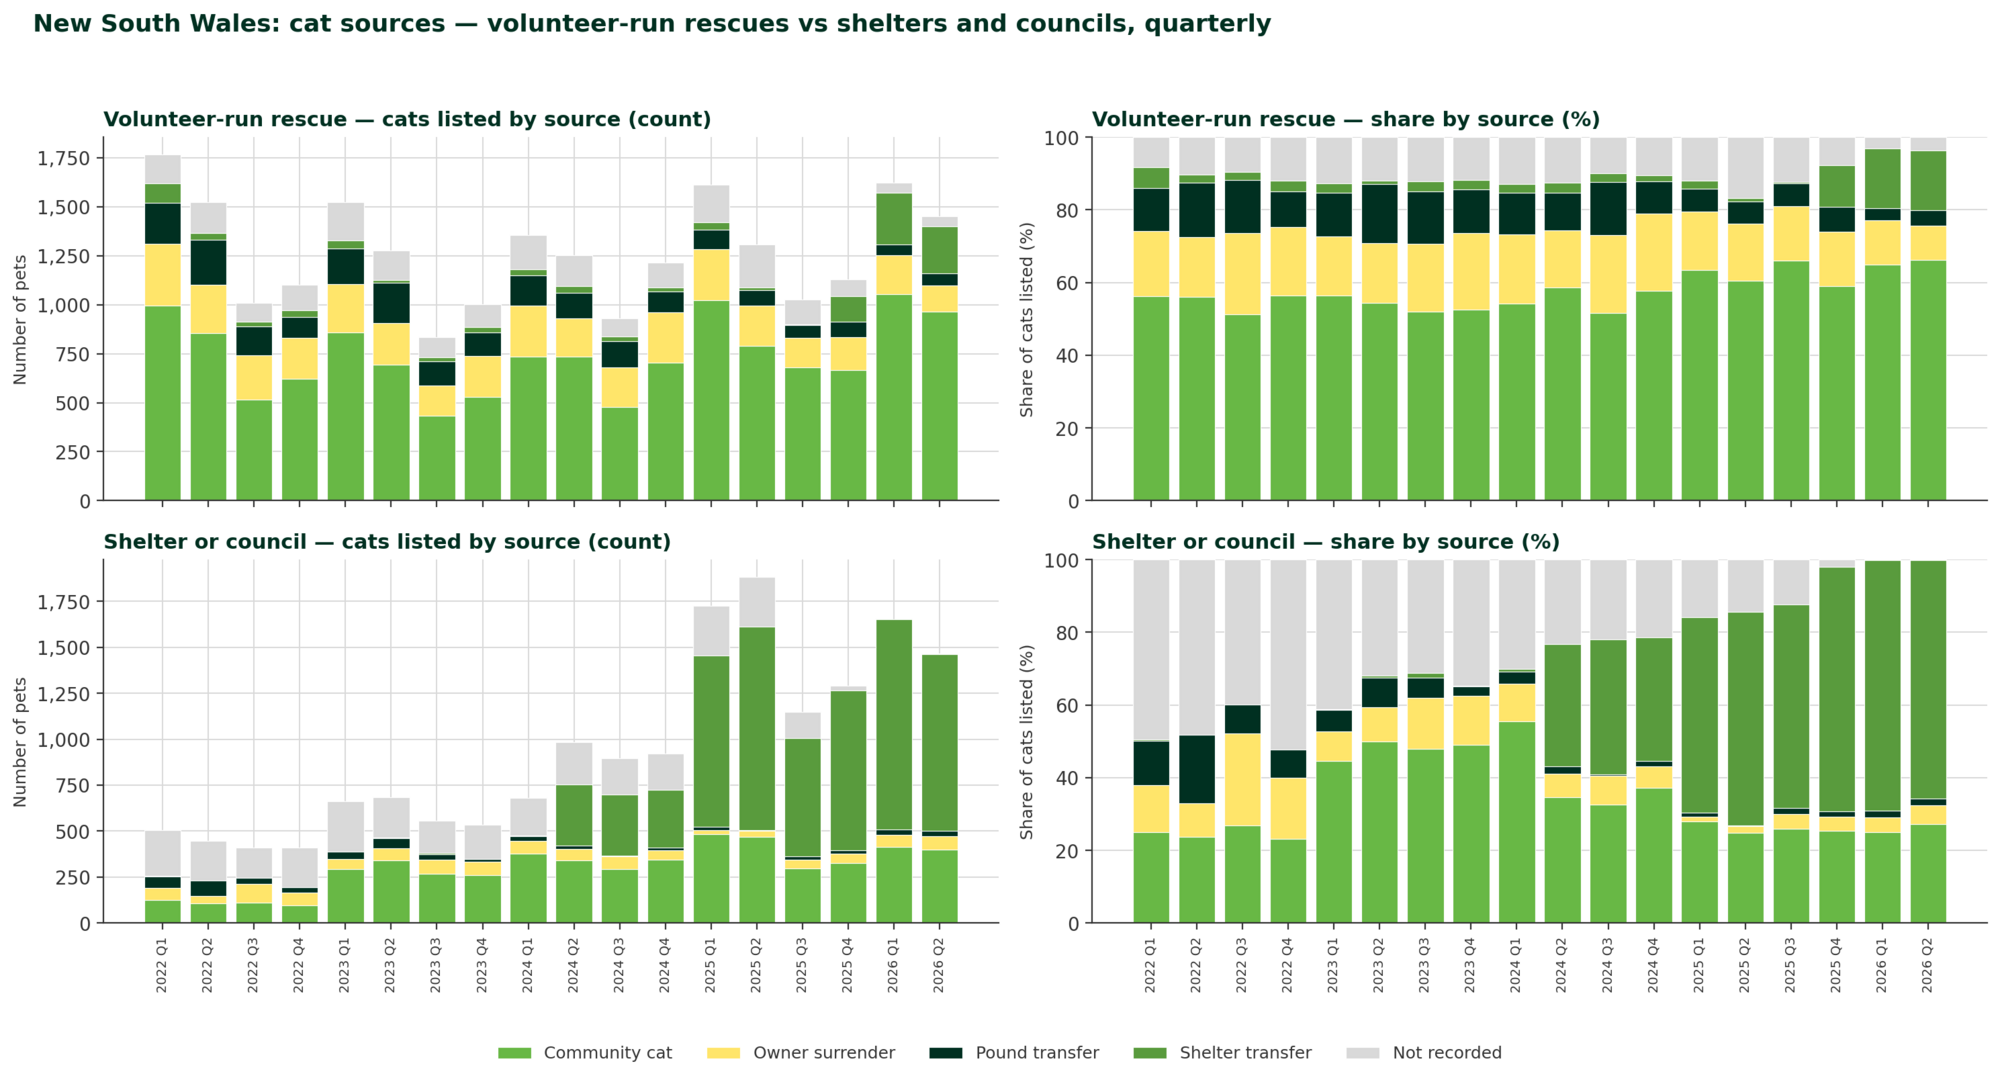
Chart 5: Cat sources, volunteer-run rescue vs shelter or council, quarterly
This chart splits the Chart 4 breakdown by organisation group: volunteer-run rescue (rescue groups excluding Home2Home) versus shelter or council (shelters and council pounds combined).
Key patterns
-
For volunteer-run rescues, community cat has been the largest recorded source throughout the period, at a broadly stable share of around 50 to 55 percent, with owner surrender the next largest recorded source.
-
For shelters and councils, the pattern is very different and changes markedly over the period. In 2022 and through most of 2023, the large majority of shelter or council cat listings had no recorded source at all, with owner surrender and pound transfer making up most of what was recorded.
-
From 2024 onward, recording completeness for shelters and councils improves substantially, and shelter transfer becomes the dominant recorded source for this group, accounting for the majority of shelter or council cat listings with a recorded source by 2025 and 2026.
-
By late 2025 and into 2026, the "not recorded" share for shelters and councils has fallen to close to zero, a marked change from the 2022 to 2023 period.
Caveat
-
The shelter or council panel in this chart should be read with particular caution for 2022 and 2023. With the majority of listing sources unrecorded for source in that period, the recorded proportions (owner surrender, pound transfer) for those quarters are based on a small and potentially unrepresentative subset of total shelter or council cat listings, and should not be treated as representative of the full intake mix at that time.
-
The apparent shift toward shelter transfer as the dominant source for shelters and councils from 2024 onward is consistent with, and may be substantially explained by, the same recording improvement, rather than a change in how cats are actually coming into these organisations' care. This distinction matters for any statement made about changing intake patterns and should be verified against the underlying data or the relevant organisations directly before being cited.